

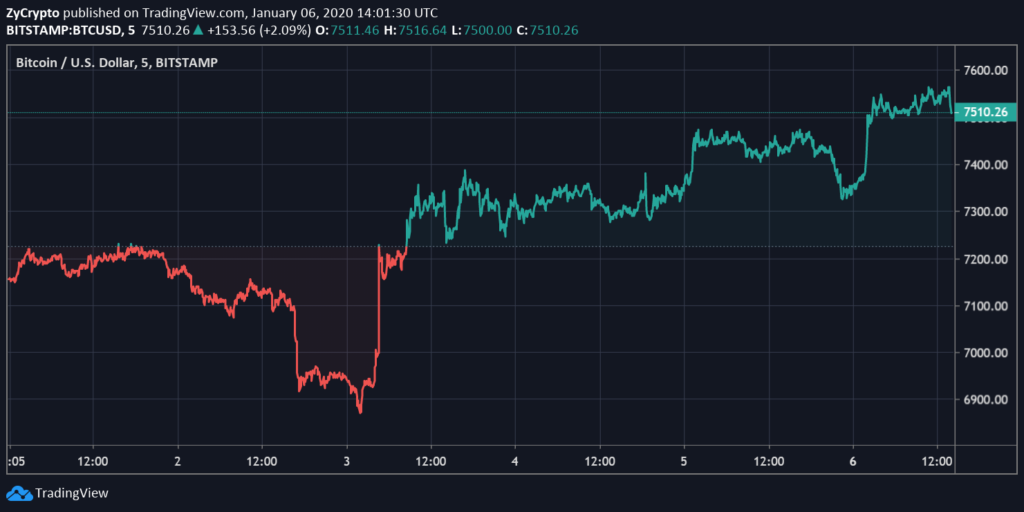
Bitcoin saw a significant 5.4% bounce three days ago after the bulls managed to defend $6,871. BTC climbed up to $7,405 breaking above both the 12 and 26-period EMA on the daily chart.
Bitcoin then formed a daily bull flag which has just been confirmed today with a 3% move to the upside and a bull cross of both EMA’s. Bitcoin is currently trading above $7,550 and it’s looking at the nearest resistance at $7,695. The RSI has remained quite even on the daily chart and trading volume only increased during the first bull move, three days ago.
Looking at the 4-hour chart, we can clearly see a shift in momentum after January 3. The bulls managed to break above both EMAs with significant trading volume and have set a 4-hour uptrend that continues to hold currently. The RSI has not been overextended just yet as BTC has experienced a healthy consolidation 24 hours ago.
Bitcoin Rallies After US Kills Iran’s Top General
Bitcoin and cryptocurrencies, in general, have done well when there is uncertainty among other markets in the world. Donald Trump, president of the United States recently warned Iran that if it tries to retaliate he will target 52 Iranian sites.
Tensions escalated further when Iran’s supreme leader promised to avenge the death of Qassem Soleimani. According to many cryptocurrency analysts, the US-Iran tensions are helping Bitcoin tremendously. Similarly, the Oil market has seen a rally too.

Bitcoin has been considered a safe-haven for the last few years and this seems to strengthen that narrative as Bitcoin is eyeing up $8,000 within the next few days.
Will Bitcoin See Another Bull Rally in 2020?
The short-term for Bitcoin has been quite uncertain for the past 2 months as Bitcoin has remained relatively stable trading in-between $6,500 and $7,700 for the majority of the time. With the upcoming Bitcoin halving, is the digital asset going to experience another bull run like that of 2017?
Looking at the longer time frames, the weekly chart is more clear and shows Bitcoin in a downtrend. The digital asset needs to break above both EMAs before trying to change the trend here.
However, the monthly chart is in an uptrend and quite positive for Bitcoin. The bulls are still looking to set a higher low here, possibly at $6,435 if the level holds. In order to confirm it, they need to set a weekly uptrend but either way, the chart is in favor of the bulls.


