

Neo has started trading in the month of July on the strong foot, rising by a total of 28% over the past 7 trading days. Neo is currently trading at $38.71, at the time of writing and has enjoyed a further 6% price hike over the past 24 hours.
Neo was rebranded from AntShares in June 2017 and is intended to become a distributed network for the smart economy. It will do this by combining digital assets, digital identity and smart contracts to create a smart economy.
Neo was developed by Shanghai based blockchain research and development company, OnChain. It is a similar network to that of Ethereum where decentralised apps can run on top of its blockchain.
However, Neo can boast about being able to process up to 1000 transactions per second, reigning supreme over the 25 transactions per second that Ethereum can currently achieve. To add to this, developers can also code smart contracts for Neo in many popular development languages as opposed to coding on Ethereum which requires Solidity to be learned beforehand.
Neo is currently ranked 12th in terms of overall market cap across the industry, with a total market cap value of $2.52 billion. The Neo economy has a significant amount of losses to retrace from the market cap of $5.96 billion seen during April. This is $3.44 billion total than the current market cap.
Let us continue to analyse price action for Neo over the long term.
Price Analysis
NEO/USD – LONG TERM – DAILY CHART
https://www.tradingview.com/x/DqGeSuCP/
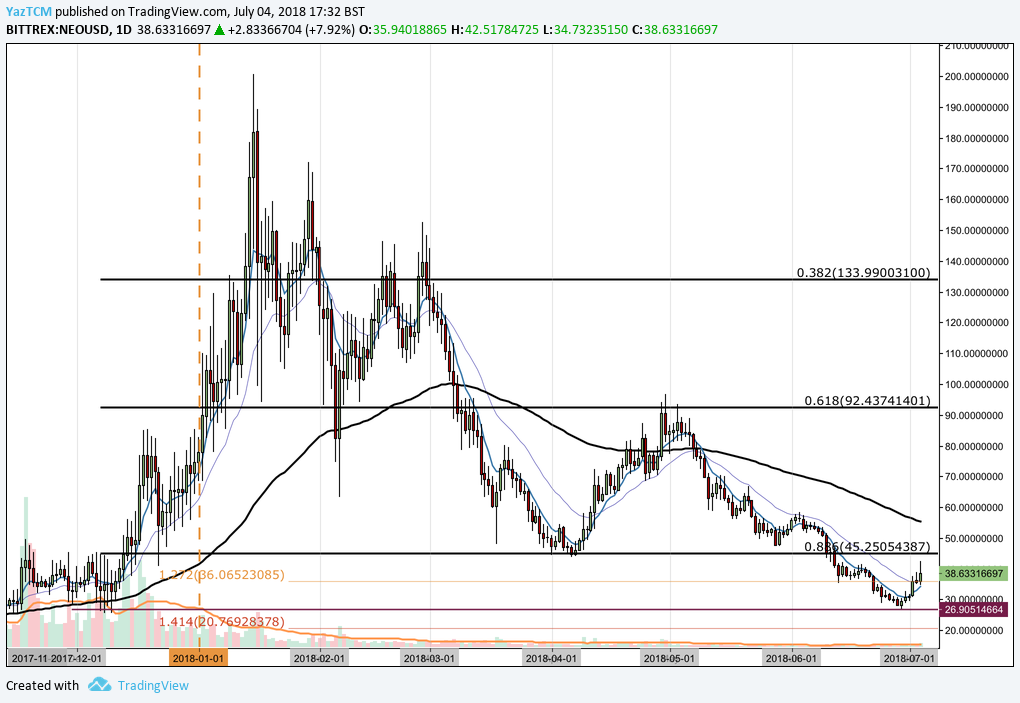
Analysing the chart from the long term perspective above, we can see that Neo had experienced a bullish run during the end of 2017, rising from a low of $26.27 in December 2017 to an all time high of $200.59 in January 2018. This was a price increase of over 700% from low to high.
After placing this all time high, price action went on to depreciate throughout the rest of the year until reaching support at the .886 Fibonacci Retracement, in April, priced at $45.25. This is A Fibonacci Retracement taken from the bullish run outlined above. The market rebounded at the .886 Fibonacci Retracement until it hit resistance at the .618 Fibonacci Retracement in May, priced at $92.43.
Price action then went on to depreciate once again during May and June, breaking below the .886 Fibonacci Retracement and finding support at December’s low of $26.90 where the market rebounded.
If the bullish momentum can push the market back above $45.25 then the nearest level of long term resistance comes in at May’s highs and the .618 Fibonacci Retracement priced at $92.43. If the market can clear this level it will be creating 4 month fresh highs.
Alternatively, if the bullish momentum recently seen dies down and the market drops back toward December’s low, we can expect support to be found at the 1.414 Fibonacci Extension level priced at $20.78.
Let us continue to analyse price action over the more recent period.
NEO/USD – SHORT TERM – DAILY CHART
https://www.tradingview.com/x/jt0tXAyz/
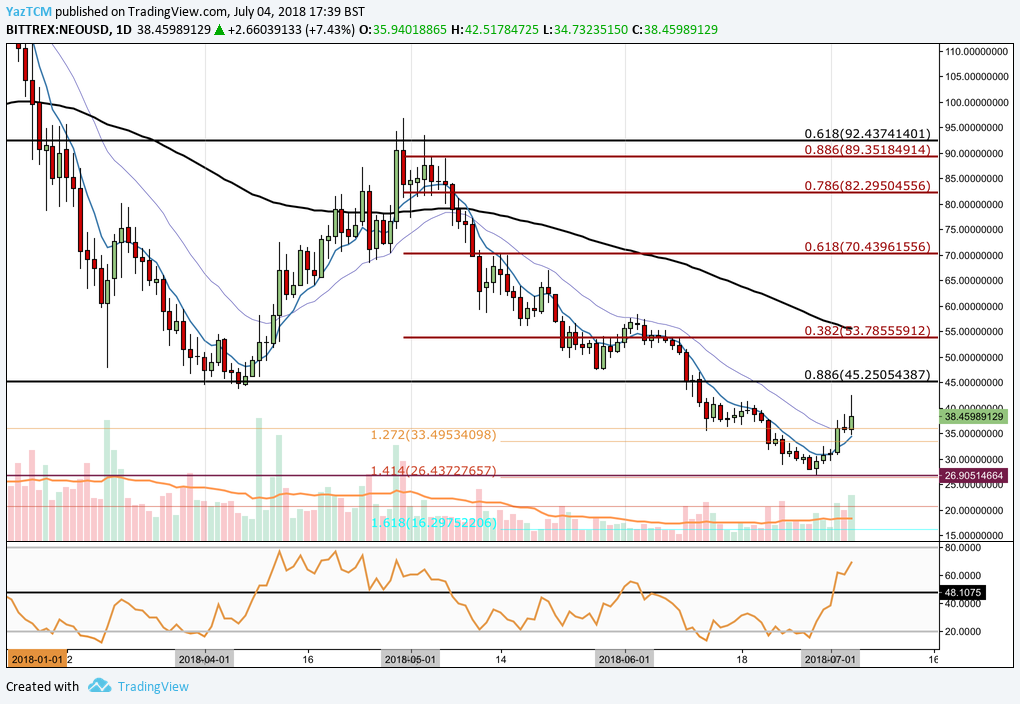
Analysing price action over the more recent term, we can see that the support found at December’s low at $26.90 is also bolstered by a short term downside 1.414 Fibonacci Extension at the same price level. We can see this strong level of support caused the market to rebound aggressively as price action makes it way back to the long term .886 Fibonacci Retracement priced at $45.25.
If the market can close back above $45.25, then immediate near-term resistance comes in at the short term .382 Fibonacci Retracement (marked in red), priced at $33.78. This is a Fibonacci Retracement taken from the bearish leg seen from May’s high all the way to the recent low experienced at the end of June. If the bullish can continue further past this level then further resistance comes in at the short term .618 Fibonacci Retracement priced at $70.43.
The technical indicators are largely leaning toward favouring the bulls at this current moment in time. After spending over two months in bearish territory, the RSI has aggressively burst above the 50 handle and is quickly approaching the overbought conditions at the 80 handle, indicating strong bullish momentum within the market. If the RSI can continue to trade above the 50 handle, this would indicate that the bulls are in control.
To add further to this, the 7 day EMA has recently approached the 21 day EMA and is posturing toward a bullish crossover when the 7 day EMA crosses above the 21 day EMA. This would indicate that the bullish momentum within the market is still increasing.


, and Stellar (XLM) Price Analysis – Recovery Expected Above Major Support Levels")