
 Technical Analysis #001 - Monero Supported at the $101 Handle; Can the Bulls Keep Us Above $100")
Monero has seen a 1.93% price drop over the past 24 hours of trading. The cryptocurrency is currently exchanging hands at a price of $105 after experiencing a 18.79% price drop over the past 7 trading days.
The cryptocurrency was created to become a private, anonymous and secure means of transaction. The creators behind the Monero currency use a cryptographic implementation known as Ring Signatures to make their transactions anonymous.
Ring Signatures work by mixing account keys with public keys on the blockchain creating a ring of possible signers of that specific transaction. This makes it difficult for anyone on looking at the transaction to figure out who is the sender or receiver. With typical blockchains today, such as Bitcoins, all transactions are made public and can be scrutinised under forensic examination.
Created in April 2014, Monero is one of the oldest cryptocurrencies surviving today with a 52 month rein. The codebase used in the creation of Monero is different to Bitcoins as it uses the CryptoNote codebase with Ring Signitaures implemented.
Monero is currently ranked at 10th position in terms of overall market cap across the entire industry. It has a total market cap value of $1.73 billion after seeing a 8.64% price increase over the past 30 trading days. Monero is a total of 78% down from it’s all time high price.
Let us continue to analyse price action for Monero over the long term.
Price Analysis
XMR/USD – LONG TERM – DAILY CHART
https://www.tradingview.com/x/VrW2lW2C/
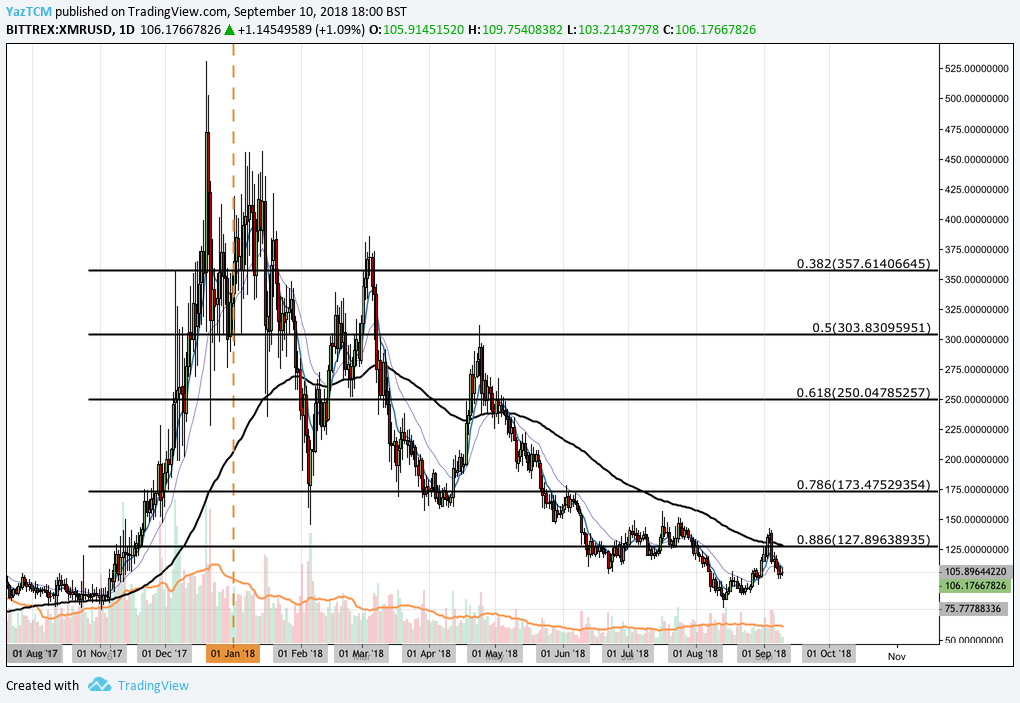
Analysing price action over the long term, we can see that the market had experienced a significant surge toward the end of 2017 when price action had started from a low of $74.77 on the 2nd of November 2017 and extended to an all time high (ATH) of $531.27 on the 20th of December 2017. This was a total price increase of 585% from low to high.
After placing the all time high, we can see that price action dropped significantly. It had originally found support at the .786 Fibonacci Retracement priced at $173 during February 2018. This Fibonacci Retracement is measured from the entire bullish run outlined above.
The support at $173 proved to hold the market a number of times during the trading year but price action continued to drop below this support during June 2018 to find support just below the .886 Fibonacci Retracement priced at $127.
We can see that price action, during August 2018, continued to fall further lower to complete a 100% FIbonacci Retracement of the entire bullish run seen toward the end of 2017. Price action rebounded aggressively as it touched this support level of $75 to push the market back above the $100 handle.
Let us continue to analyse price action a little closer over the shorter term and highlight any potential support and resistance areas.
XMR/USD – SHORT TERM – DAILY CHART
https://www.tradingview.com/x/n42Rpoz0/

Analysing the market from the short term perspective above, we can see that the recent support at the $75 handle was significantly bolstered by a downside 1.414 Fibonacci Extension level priced at $78. This combined area of support caused the market to rebound and continue higher.
We can see that price action continued to rally until it had met resistance at the 100 day moving average where it rolled over and reversed once again. The market then dropped slightly to where it is currently trading around the downside 1.272 Fibonacci Extension level priced at $101.
If the bearish pressure continues to push price action belo the support at $101 then we expect immediate significant support below to be located at the previous downside 1.414 Fibonacci Extension level priced at the $78 handle. Further support below this is then expected at the $75 handle followed by the psychological round number handle of $70.
Alternatively, any bullish pressure is expected to meet resistance at the 100 day moving average once again. This area of resistance is further significantly bolstered by the long term .886 Fibonacci Retracement level priced at $127 and will require significant momentum and volume to overcome.
The technical indicators have recently swung into the favour of the bears as the RSI recently dropped below the 50 handle. If we would like to see further gains within this market we will need to see the RSI make its way back above the 50 level.


