

Supply levels: $121, $131, $151
Demand levels: $109, $98, $82
ETH/USD Medium-term Trend: Bullish
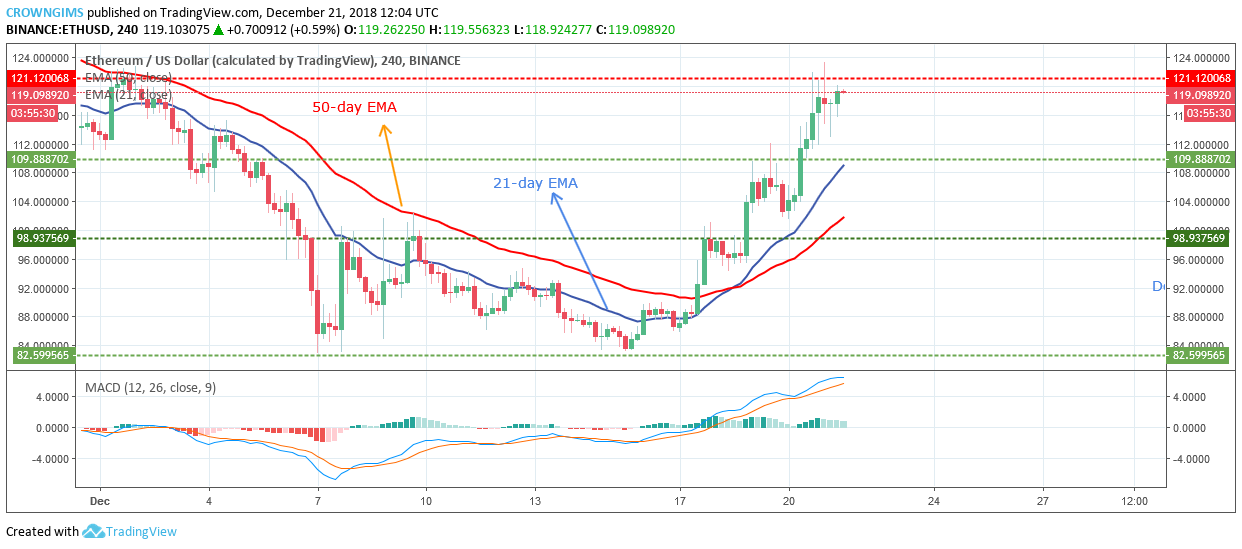
On the medium-term outlook, ETH/USD is in an uptrend. ETH bottomed at $82 demand level on December 15 due to bears’ momentum. The bears lost the pressure after the formation of a bullish inside bar candle. The bull’s pressure pushed the coin to the high of $121 after several barriers have been broken such as old supply level of $98, $109 and $121 where further price increase was rejected by the bears. The rejection seems to be a price correction before continuing an uptrend movement.
The bulls were fully in control of the ETH market as it can be seen clearly on the 4-Hour chart that ETH price is making Higher Highs. The 21- day EMA has crossed the 50-day EMA with ETH price trading above the two EMAs is an indication of a strong bullish momentum on the ETH market. The MACD period 12 with its histogram is above zero levels and the signal lines above the histogram point up; which indicate that the coin may continue increasing (strong buy signal) and may have $131 as its target.

ETH/USD Short-term Trend: Bullish
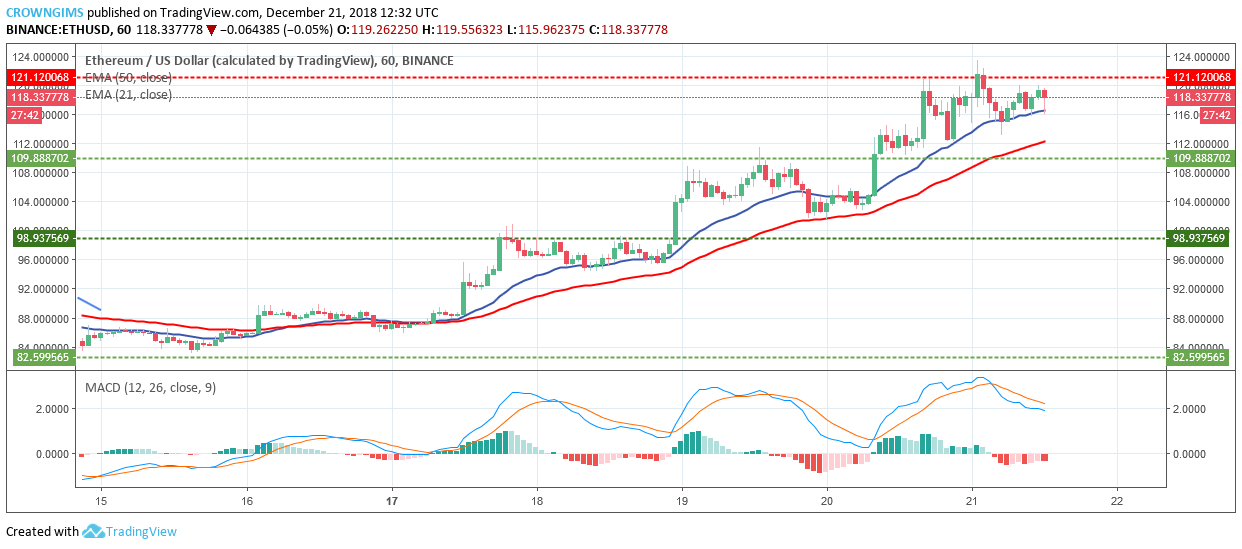
ETH is on the strong bullish trend on the short-term outlook. The ranging movement between the supply level of $102 and the demand level of $92 which took the coin several days was terminated on December 19 as the bulls gained pressure and pushed the coin to break out of the range-bound zone. Early today, bullish momentum made the coin topped at $121 and price retracement carried out so as to continue its bullish trend.
However, the MACD period 12 with its histogram is found below zero levels with the signal line points down indicate sell signal. Traders should not use this as the opportunity to place short position as this may be price retracement. Taking a long position is advisable.
 Price Up 62% From Bottom, Can The Bulls See More Gains?")

