
 Technical Analysis - Breaks Below Previous Triangle to Trade Below $300; Bulls Continue to Defend the Market at $270")
Ethereum has seen a 0.75% price drop over the past 24 hours of trading. The cryptocurrency is currently exchanging hands at $289 after experiencing a well received 4.67% price hike over the past 7 trading days.
Since our last analysis, Ethereum has dropped below all of our expected support levels during its precipitous decline. Below we have updated the analysis and have highlighted further support and resistance areas.
Ethereum is now currently trading at 9 month lows and is at the lowest levels seen throughout the trading year. Can the bears keep pushing the market even further? It seems that the bulls are struggling to defend the $300 handle but are still refusing to let it out of their sights as they, once again, attempt to regain some of the losses experienced over the past few weeks.
Ethereum is still holding the number 2 position in terms of overall market cap across the entire industry. It has a total market cap value of $29 billion after suffering a steep 90 day price drop totalling 50%.
Let us continue to analyse price action over the short term for Ethereum to highlight any potential support and resistance areas.
Price Analysis
ETH/USD – SHORT TERM – DAILY CHART
https://www.tradingview.com/x/1x7YGuLI/
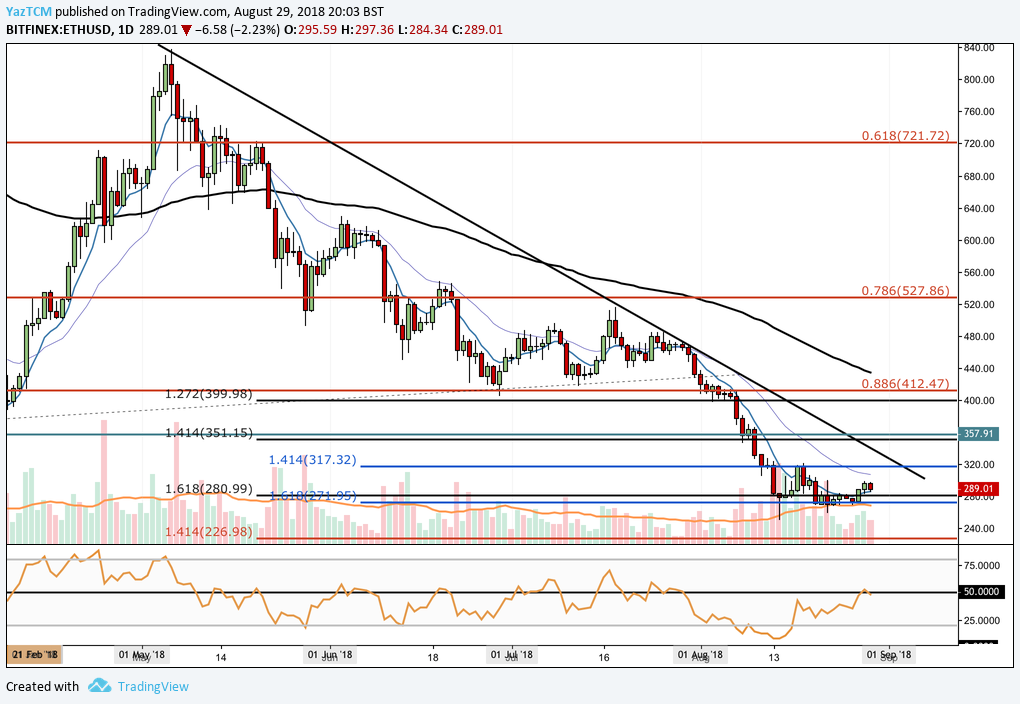
Ethereum has fallen considerably since our last analysis. We had outlined a potential symmetrical triangle ending toward the end of July. We can see that price action has since broken through the bottom support line of the triangle and significantly fallen.
The August bloodbath affected many cryptocurrencies including Ethereum. We can see that the market dropped from $400 to below $300. Price action still has yet to recover above $300 as it trades at $289.
We can see that the sharp decline was supported by a short term downside 1.618 Fibonacci Extension level (drawn in blue) priced at $271. This area of support was bolstered by a longer termed downside 1.618 Fibonacci Extension level (drawn in black) priced at $280. After hitting this support level, the market has been trading sideways in a range bound between $271 – $317.
If the bulls can push price action, firstly, above $300 and then $317 we expect further resistance to be located at the downward sloping trend line drawn in black. Further resistance above this level is the expected at previous support (now turned resistance) priced at $357 followed by the psychological round number handle of $400.
Alternatively, if the bears re-enter the market, we expect any downward pressure to be supported by the $271 handle. IF the market does indeed penetrate further lower we expect further support to be located at a longer termed downside 1.414 Fibonacci Extension level priced at $226.
The technical indicators are still favouring the bears at this current moment in time within the market. The RSI has attempted to recently break up above the 50 handle but was unable to sustain itself above 50. It is currently trading directly on the 50 line indicating that the market is still deciding in which direction it wishes to continue toward next. If the RSI can sustain a break above the 50 handle we could expect this market to begin to make gains above the $300 handle.
Similarly, the moving averages are still favouring the bears at this moment in time as the shorter moving averages trade below the longer moving averages. If the 7 day EMA 9 (blue moving average) can eventually turn and cross up above the 21 day EMA (purple moving average) this would constitute a bullish crossover within the market and would signal that the bullish pressure is increasing.
Ethereum has been below $300 for a significant amount of time during August. Hopefully, over the next few weeks the bulls can increase the pressure and bring ETH back up above the stated level.
https://www.tradingview.com/x/4OwuEMHE/
, and Stellar (XLM) Price Analysis – Recovery Expected Above Major Support Levels")
 and Stellar (XLM) Weekly Price Performance Overview")
