
![Ethereum [ETH] and Bitcoin [BTC] Price Analysis June 14](https://zycrypto.com/wp-content/uploads/2018/06/Ethereum-ETH-and-Bitcoin-BTC-Price-Analysis-June-14.png "Ethereum [ETH] and Bitcoin [BTC] Price Analysis June 14")
- The 50% Fibonacci retracement will limit the earnings around $ 500, while the 61.8% retracement is holding it at $ 483.
- The ETH / USD has formed a short-term bullish flag pattern, pending another upward break in the medium term.
Like most cryptocurrencies, the Ethereum price continues to correct upwards on Thursday. The Ethereum dropped below the $ 470 support in yesterday’s session and reached the $ 450 area before turning. He formed a short bullish flag pattern toward the end of the session, but broke back upward during today’s Asian session. However, the rise has been limited around $ 490 and attempts to break above this level have been limited by selling pressure.
The ETH / USD has formed another short-term bullish pattern, a pattern that could be overcome by breaking the $ 490 level and approaching the key resistance zone by $ 500. However, at this level bulls will have to fight resistance to 50% of the Fibonacci retracement level. A weak upward momentum is forming on the chart, in addition to the stochastic is at 32% and sends bullish signals in the short term.
On the other hand, the 50-period moving average in the 15-minute chart is above the 100 SMA and supports the price at the $ 483 level. At this level, 61.8% of the Fibonacci retracement also converges. Below, the 100-period moving average will support the falls at the $ 480 level, before the $ 470 support.
ETH / USD 15 minute chart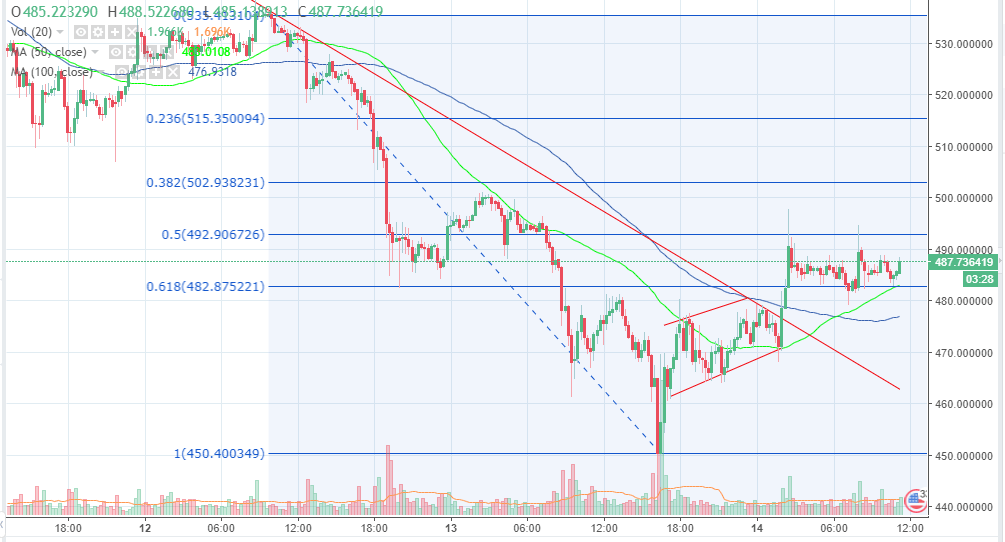
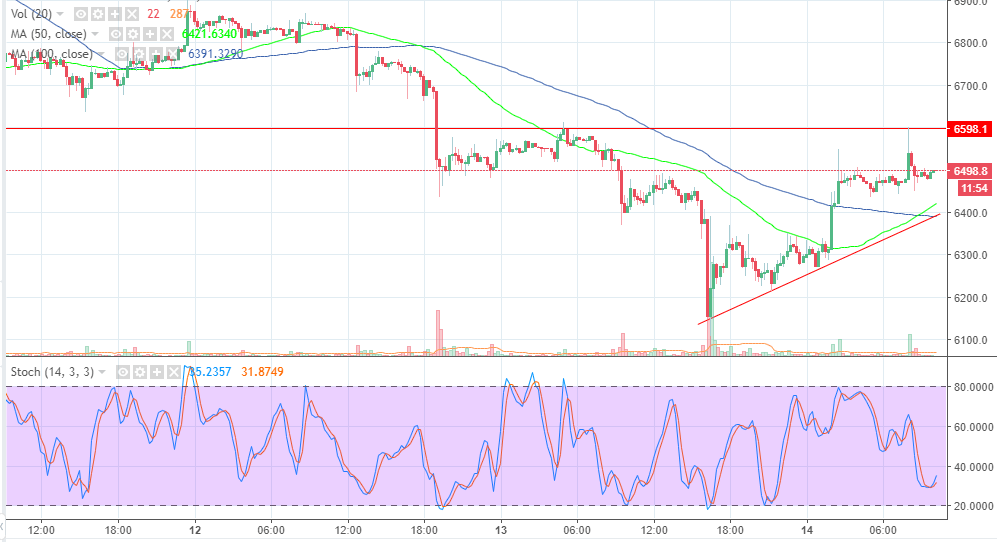
The BTC / USD finds a weak support at $ 6,450, but the moving averages and the uptrend line will offer more support at $ 6,400.
- The 50 SMA has crossed above the 100 SMA in the 15-minute chart to indicate that buyers are gaining more control.
The Bitcoin price has embarked on a bullish move after falling below the $ 6,200 level, but found support at $ 6,150. The price bounced off the support and rose above short-term resistance at $ 6,300, before another upward movement that culminated in a bullish flag pattern supported above the $ 6,400 level.
The stochastic in the 15-minute chart is around level 30, and shows signs of bullish movements in the short term. The 50 SMA has crossed above the 100 SMA in the 15-minute chart to indicate that the bulls are taking over. Currently, the BTC / USD is flirting with the $ 6,500 level, while the immediate resistance has limited the intraday highs by $ 6,550.
The Bitcoin price is forming a bullish flag pattern, pending another upward movement that will see it rise to the immediate resistance zone at $ 6,600-6,700. In the event of a bullish break, bulls could gain momentum to face the key resistance level at $ 6,800. On the other hand, the BTC / USD has a weak support at $ 6,450, but the moving averages along with the uptrend line will offer more support at the $ 6,400 level. If the falls extend, the BTC / USD could fall to the demand zone at $ 6,200, a move that could cause it to test February’s lows below $ 6.1000.
BTC / USD 15 minute chart
 Long Positions at All-Time High Yet Price Remains Stagnant")
, and Stellar (XLM) Price Analysis – Recovery Expected Above Major Support Levels")
 and Stellar (XLM) Weekly Price Performance Overview")