

EOS has seen a small price decline totalling -0.4% over the past 24 hours of trading The cryptocurrency is currently exchanging hands at a price of $5.45 after seeing stability over the past 7 trading days moving only a small -0.16%.
EOS was designed to become the most powerful infrastructure for decentralised applications. It leverages vertical and horizontal scaling to allow for the network to facilitate a high level of transactions.
Since the EOS blockchain was launched, the user base has continuously grown over time. The latest figures estimate over 419K EOS accounts on the network. We have to keep in mind that opening an account on EOS is not free and requires a small fee. This is the opposite to traditional blockchains such as Ethereum where users are able to create 1000s of accounts for free.
If we are to analyse the total users that actually decentralised applications on each network we would find that EOS comes out on top. The EOS network has an estimated 15,000 users utilising its dapp network compared to Ethereum which only has a total of 10,000 active users on its network. Both numbers are impressive at such an early stage and we will need much more time to compare them both to have a realistic conclusion.
EOS is currently ranked in 5th position in terms of overall market cap across the entire industry. It currently holds a total market cap value of $4.44 billion after suffering a precipitous 30% price drop over the past 90 trading days. The 16 month old coin us currently trading at a price that is 74% lower than its all time high price.
Let us continue to analyse price action for EOS over the long term and assess the market behaviour.
Price Analysis
EOS/USD – LONG TERM – DAILY CHART
https://www.tradingview.com/x/4w7SJKzx/
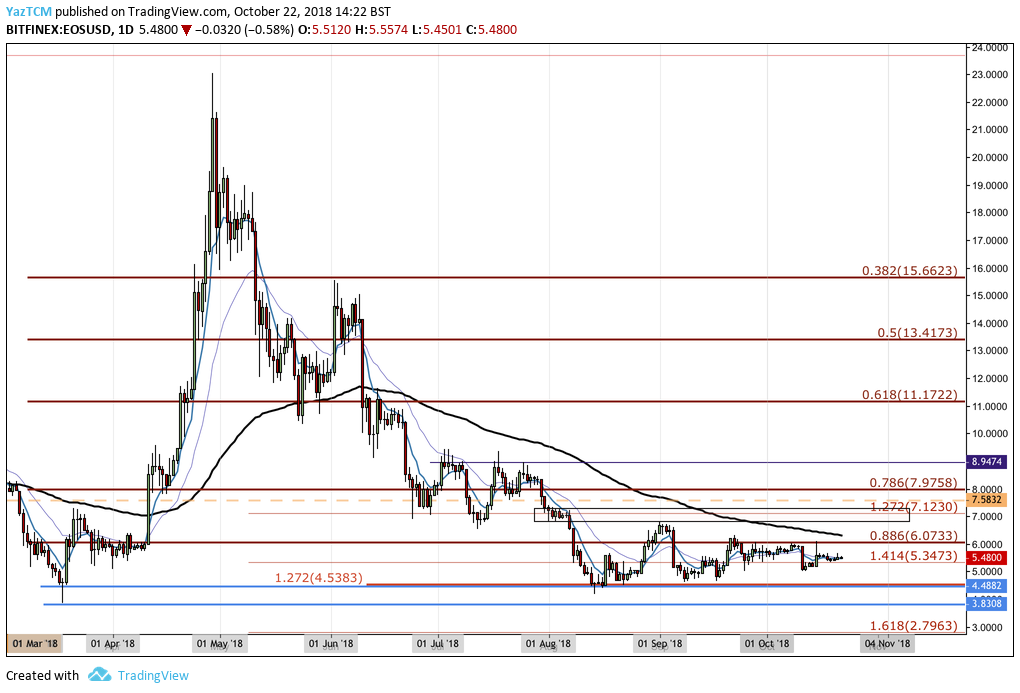
Analysing price action for EOS over the long term perspective above, we can see that the market had dipped below our previously highlighted support area at the long term .886 Fibonacci Retracement level priced at $6.07. Price action continued to drop further lower until finding support at the downside 1.272 Fibonacci Extension level priced at $4.53.
The market has since rebounded from this support area and has trading in a coiling consolidation pattern over the past 8 weeks as the market players battle to decide which direction to head toward next.
Let us continue to analyse price action a little closer over the short term perspective and highlight any potential support and resistance levels moving forward.
EOS/USD – SHORT TERM – DAILY CHART
https://www.tradingview.com/x/nfz3TEou/
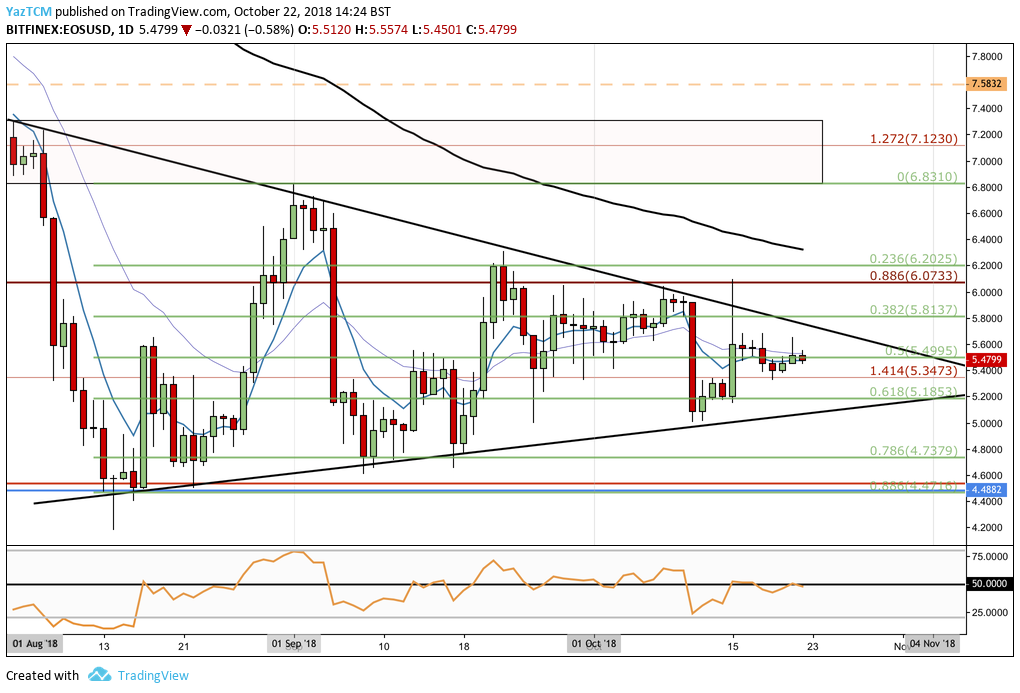
Analysing price action over the short term perspective, we can see that price action had experienced a small bullish run when the market started at a low of $4.17 on the 14th of August and extended to a high of $6.82 on the 1st of September 2018. This was a price increase totalling 62% from low to high.
We can see that after placing the high, price action rolled over and began to fall. It continued to fall until finding support at the short term .786 Fibonacci Retracement level (drawn in green) priced at $4.73. This Fibonacci Retracement is measured from the short term bullish run highlighted above. Price action, once again, rebounded from this level of support until it met resistance at the short term .236 Fibonacci Retracement level (drawn in green) priced at $6.2025.
We can also see that over the past 8 weeks, the market has been establishing the formation of a symmetrical triangle pattern. The triangle is characterised by the upper falling boundary and the rising lower boundary. Price action is quickly approaching the apex of the triangle where a breakout is expected in either direction.
Moving forward, if the bears step into the market and push price action lower we can expect immediate support below the short term .618 Fibonacci Retracement level (drawn in green) priced at $5.18. If the market continues further lower then more support will then be expected at the lower boundary of the symmetrical triangle.
If the bears push price action below the lower boundary of the triangle then further support below can then be expected at the .786 Fibonacci Retracement level (drawn in green) priced at $4.73.
On the other hand, if the bulls pressure price action higher we can expect immediate resistance above at the upper boundary of the triangle. If the bulls can push the market above the upper boundary of the triangle we can expect further resistance higher at the short term .382 Fibonacci Retracement level (drawn in green) priced at $5.81 followed by the long term .886 Fibonacci Retracement level (drawn in red) priced at $6.07.
The market would need to break above $6.20 and then $6.83 before being able to move on higher to contest above $7.
, and Stellar (XLM) Price Analysis – Recovery Expected Above Major Support Levels")
 and Stellar (XLM) Weekly Price Performance Overview")
