DigiByte has seen a small 1.15% price hike over the past 24 hours of trading. The cryptocurrency is currently exchanging hands at a price of $0.0237 after seeing a further small 1,72% price increase over the past 7 trading days.
The market has been trading along the path of a long term upward sloping trend line and has remained confined above it for many months.
The Founder of DigiByte had recently publicly aired his opinions relating to Binance recently on Twitter. Tate went on a Tweet storm to explain why DGB has never been listen on Binance. Last summer, after completing many legal requirements to be added the DGB team refused to pay a donation fee to the Binance team to be listed on the exchange. Binance had long been known to be charging extraordinary fees to be listed on their exchange which had recently gotten out of hand. Binance have recently come out and have stated that from now on they will be donating all of their donation listing fees to charity.
However, Jared Tate went on further to state that he has been told to publicly apologise to CZ, the owner of Binance, in the hopes that DGB will be listed on Binance.
DGB is currently ranked in 36th position in terms of overall market cap across the entire industry. It currently holds a total market cap value of $259 million as the 56 month old coin is currently trading 81% lower than its all time high value.
Let us continue to analyse price action for DGB over the short term and highlight any potential support and resistance zones.
Price Analysis
DGB/USD – SHORT TERM – DAILY CHART
https://www.tradingview.com/x/MnlYNx9k/
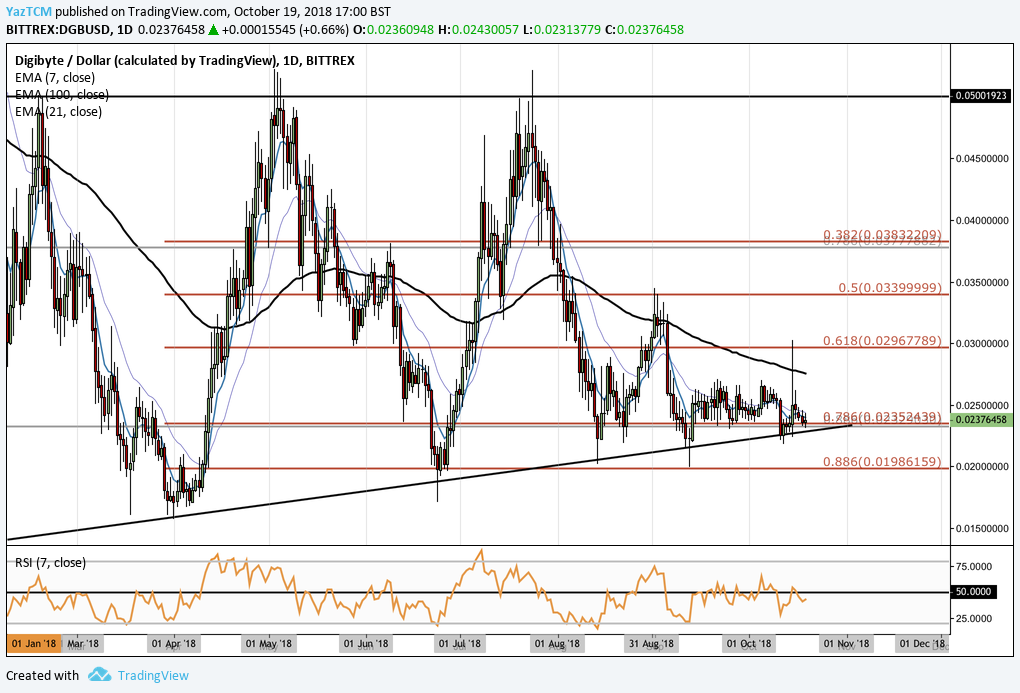
Analysing the market from the short term perspective above, we can clearly see that upward sloping trend line which has been supporting the market for over 10 months now. Each time the market approaches this level the bulls defend the area aggressively causing price action to rebound.
We can also notice that price action is trading at a strong area of combined support with the .786 Fibonacci Retracement priced at $0.02352. This Fibonacci Retracement is measured from the 225% bullish price increase when the market started from a low of $0.01574 on the 1st of April 2018 and extended to a high of $0.0522 on the 3rd of May 2018.
Moving forward, the support at $0.02352 is expected to hold strongly due to the combination with the upward sloping trend line. If the bears to manage to penetrate below this level of combined support we can expect immediate significant support below to be located at the .886 Fibonacci Retracement level priced at $0.01986.
Alternatively, if the bulls can regather momentum and push price action higher from this level of support, we can expect immediate resistance above to be located at the psychological round number handle at $0.0250. Resistance above this can then be expected at the 100 day moving average which currently floats around the $0.027 handle.
If the bullish momentum can push the market market further higher we can expect more resistance above to be located at the .618 Fibonacci Retracement level priced at $0.02967 followed by the .5 Fibonacci Retracement level priced at $0.03399.
The technical indicators within the market have recently slipped into the favour of the bears at this moment in time. The RSI is currently trading underneath the 50 handle which indicates that the bears are in control of the momentum within the market. If the RSI can break above the 50 line we can expect this market to move up and make some gains.
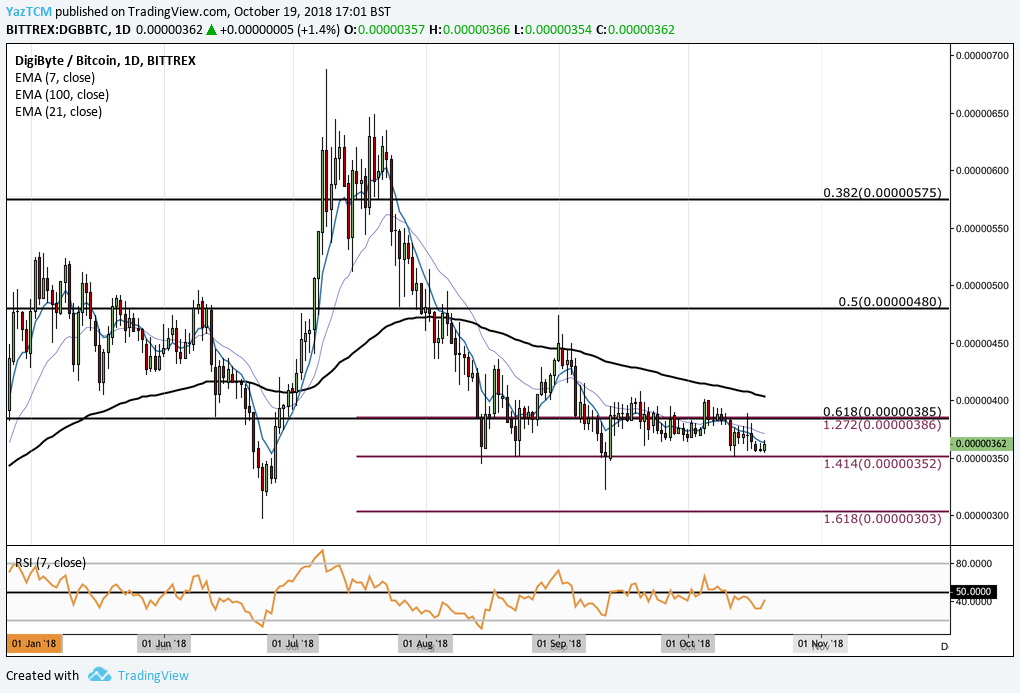
DGB/BTC – SHORT TERM – DAILY CHART
https://www.tradingview.com/x/seM1tI65/