
 Technical Analysis #004 - DGB Rebounds at Long Term Rising Support Line; Are the Bulls Lining Up for a Run Toward $0.05")
DigiByte has seen a 4.70% price increase over the past 24 hours of trading. The cryptocurrency is currently exchanging hands at a price of $0.0258 after seeing a further 5.68% price increase over the past 7 trading days.
Although the news has been relatively quiet for DigiByte, the team have been hard at work with development and keeping up appearances. This is evident in their recent medium post which went over DigiBytes recent roadmap and milestones. Some of the most impressive achievements released in Q3 alone include an appearance at Digital Currency con 2018, the Android Wallet and IOS release and the Guarda DGB Web Wallet release.
DigiByte is currently ranked at 34th position in terms of overall market cap across the entire industry. It currently has a total market cap value of $278 million after the 55 month old coin suffers a drop of 80% from its all time high price.
Let us continue to analyse price action over the medium term and highlight any further support and resistance price areas.
Price Analysis
DGB/USD – MEDIUM TERM – DAILY CHART
https://www.tradingview.com/x/aCdCPv0K/
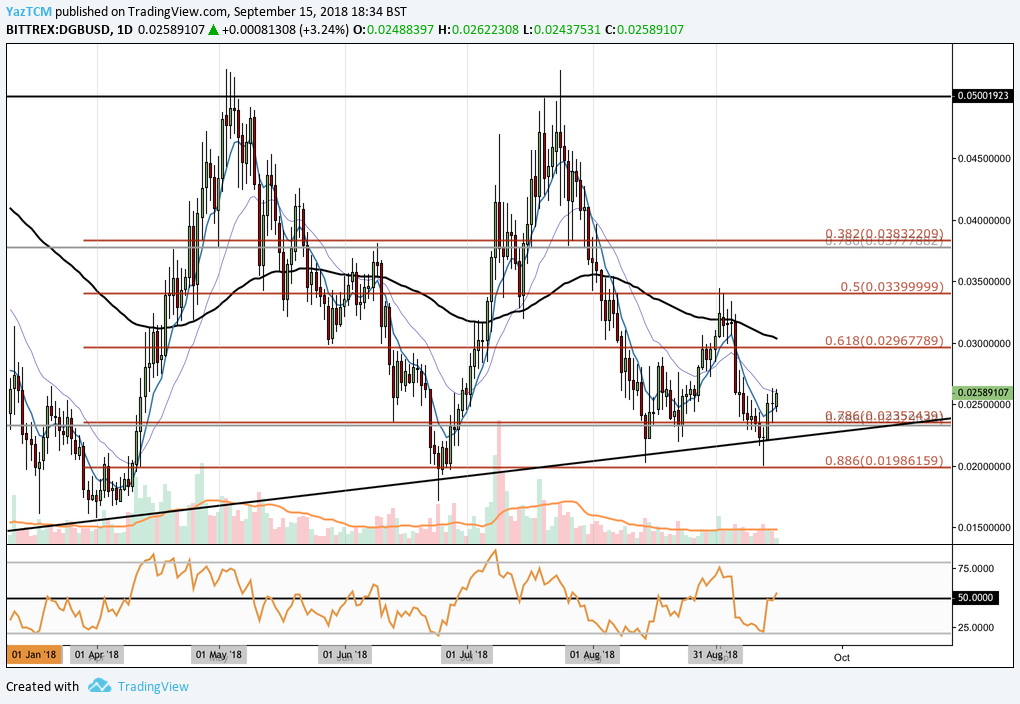
Analysing the market from the medium termed perspective above, we can see that our highlighted area of support from our last article, at the .886 Fibonacci Retracement priced at $0.1986 had held strongly as the market rebounded aggressively at this area of support.
We can also notice that price action has remained within the confines of our long term ascending trend line. This trend line has been in play for over 10 trading months and has supported the market each time it has approached this level.
We can see that the market has rebounded from this combined area of support. If the bearish pressure can continue, we expect immediate resistance to be located at the .618 Fibonacci Retracement level priced at $0.2976. Further resistance above this level can then be expected at the September 2018 highs at the .5 Fibonacci Retracement level priced at $0.339999.
If the bullish pressure can continue even higher we expect further resistance to be located at the .382 FIbonacci Retracement priced at $0.03822 followed by signifcant resistance around the $0.05 handle.
Alternatively, any bearish pressure is expected to be absorbed at the upward sloping trend line and the .886 Fibonacci Retracement priced at $0.01986.
The technical indicators are beginning to show sings that any favour the bulls. The RSI has just penetrated slightly above the 50 handle indicating that the bulls are starting to take control of the momentum. The recent rise of the RSI from oversold conditions may indicate that the previous bearish momentum has faded which would give space for the bulls to take over.
Let us continue to quickly analyse price action a little closer over the shorter term.
DGB/USD – SHORT TERM – 4HR CHART
https://www.tradingview.com/x/aeypEPgE/
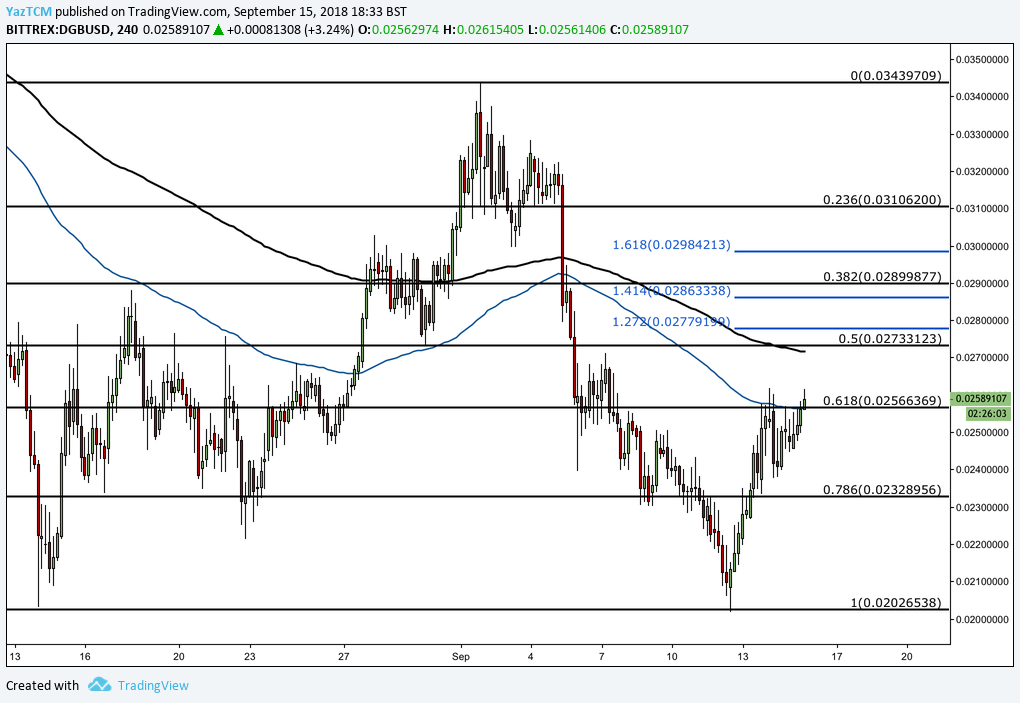
Analysing price action from the short term perspective above we can see that the market has experienced a recent bullish price increase as the market started from a low of $0.02031 on the 14th of August 2018 and extended to a high of $0.03434 on the 1st of September 2018. This was a price increase totalling 15% from low to high.
We can see that price action has since rolled over to complete a 100% Retracement of this bullish run and has rebounded. This short term Fibonacci Retracement is measured from the entire bullish run outlined above. It is currently trading at support defined by the short term .618 Fibonacci Retracement level priced at $0.02566.
If the bullish momentum can continue, we expect immediate resistance to be located at the .5 Fibonacci Retracement level priced at $0.27 followed by the .382 FIbonacci Retracement priced at $0.02899.
ALternatively, any bearish momentum is expected to be support at the .786 Fibonacci Retracement priced at $0.02328 followed by the initial starting price of the bull run priced at $0.02.


