Dash has experienced another 13% drop over the past 24 hours of trading. The cryptocurrency is currently exchanging hands at $134.80 after suffering a furhter 33.39% drop over the past trading week. It is important to point out, however, that this market drop has been witnessed across the entire industry and is not just localised to Dash.
Dash was rebranded from Dark Coin in 2015 and was intended to become a privacy focused cryptocurrency with a DAO (decentralised autonomous organisation). The cryptocurrency has seen rapid rates of adoption, most notably in the recent period received from Venezuela as the Venezuelan financial economy collapses.
Dash is currently sitting at 13th place in terms of overall market cap. It has a total market cap value of $1.11 billion. The cryptocurrency has significant losses to regain losing around 41% over the past 30 trading days.
Some of the significant levels of support have been penetrated since our last analysis and have been updated below.
Let us continue to analyse price action for Dash over the long run.
DASH/USD – LONG TERM – DAILY CHART
https://www.tradingview.com/x/TBudQmds/

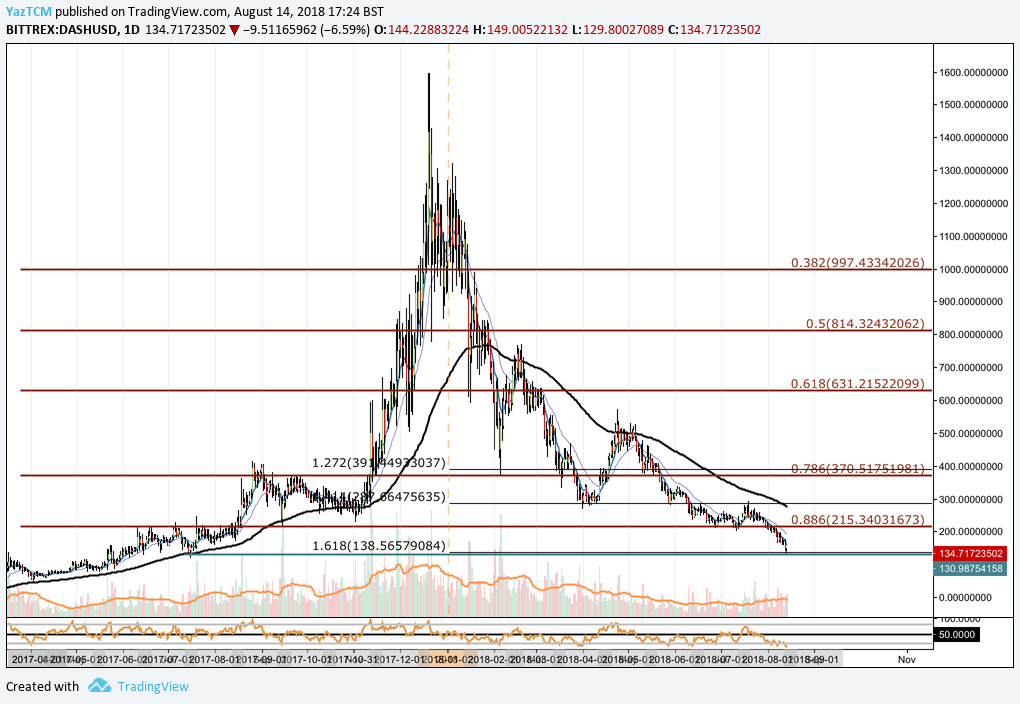
Analysing the market from the long term perspective above, we can see that the initial bullish wave seen in 2017 from Dash started from a low of $52 on April 2nd and extended to a high of $1596 . This was a price increase totalling 3500% from low to high.
After placing the all time high, price action rapidly decreased. It originally found support at the .618 Fibonacci Retracement priced at $631 in January. This Fibonacci Retracement is measured from the entire bullish run outlined above.
Price action continued to decline throughout the rest of the year, falling below the .786 and .886 Fibonacci Retracements, where support was expected to build. As of today, Dash has now completed a 100% Retracement from the entire bullish run aforementioned and has currently found support at the initial starting price of the bullish run.
We can see that this level of support is also significantly bolstered by a 1.618 Fibonacci Extension level priced at $138.56.
Let us continue to analyse price action a little closer over the shorter time frame to highlight any potential support and resistance zones.
DASH/USD – SHORT TERM – DAILY CHART
https://www.tradingview.com/x/LG0gAXGB/

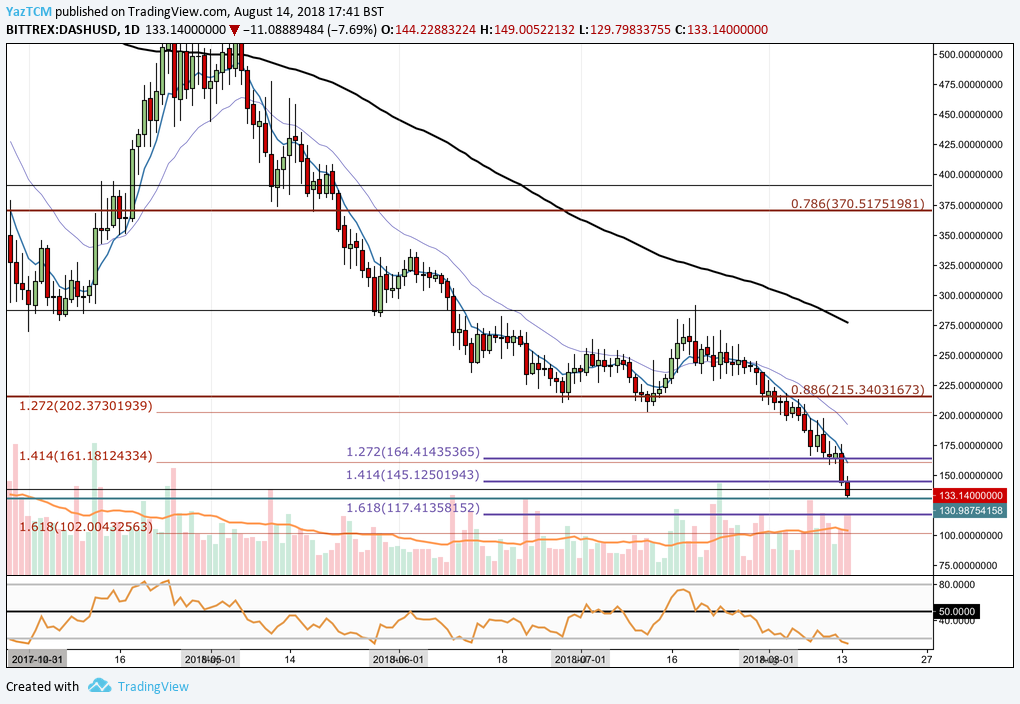
Analysing the market from short term perspective, we can see that Dash has significantly struggled to find any support throughout August. On the chart are a series of downside Fibonacci Extension levels, all measured at different time periods, highlighting potential support areas that we expect the market will be able to hold at.
In our previous analysis we had expected the downside 1.414 Fibonacci Extension (drawn in red) priced at $161 to hold. We can see that for the trading week last week, the Fibonacci Extension level did provide a brief level of support. However, over the past two trading days price action has fallen below this level.
We can see that price action is currently sitting at the initial starting phase of the 2017 bullish run, highlighted by the turquoise horizontal line.
If the overpowering bearish sentiment continues, we expect immediate support to be located at the shorter term downside 1.618 Fibonacci Extension (drawn in purple) priced at $117.41. Further support expected below this level is located at the longer term downside 1.618 Fibonacci Extension (drawn in red) priced at $102. Further support below this level is expected at the psychological round number of $100.
Alternatively, if the bulls can gather some momentum at this price level, we expect immediate resistance to be located at the $150 handle followed by the short term 1.272 Fibonacci Extension (drawn in purple) priced at $164. Resistance above both of these two levels is then expected around the $200 handle.
The technical indicators are currently heavily favouring the bearish cash at this current moment in time. The RSI is currently trading well below the 50 handle in extreme oversold conditions. If the RSI begins to make its way back to toward the 50 handle this would be a sign that the bearish momentum is fading within the market.
Advertisement


