

The bears continue to dominate the markets following the aftermath of the Bitcoin Cash hard fork last month. The hard fork had a negative ripple effect on the rest of the cryptocurrency markets as prices nose-dived beyond initial support levels.
Over the last 24 hours, most pairs turned red on price analysis charts, a phenomenon is seen throughout the week. Most altcoins took a heavy loss today, recording a double-digit percentage loss.
Bitcoin (BTC/USD)
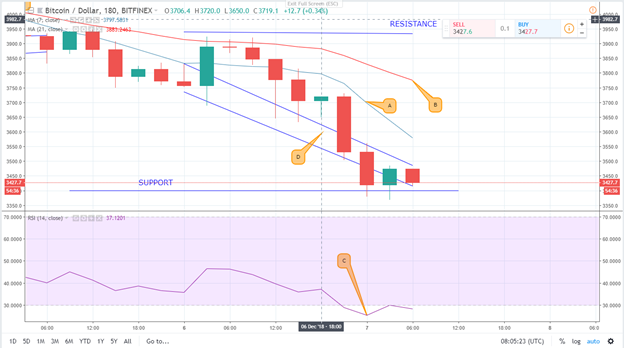
Bitcoin lost by 7.87% since yesterday. It began the day trading at $3771 against the current exchange rate of $3474 against the dollar. The downward rally has seen Bitcoin test the $4000 support level and breaches it. Resistance still holds at the $4000 mark but support has come down to around $3400 as indicated in the chart.
On 3 hour charts, the BTC/USD pair hit a high of 3920 over the last 24 hours and a low of $3368.Both moving averages, marked A and B, are headed downwards, indicating the strong bearish momentum that has engulfed the markets. Also, the 21 day EMA (A) is above the 7-day moving average (B), further signaling the bearish momentum may last a while.

Point D shows a contracting triangular pattern formed by the downward spiral that is also an indicator of a bearish trend.
Investor sentiments have turned negative as a result of the bearish outlook. The Relative Strength Index (RSI)-marked C has today dipped into the ‘oversold’ area and is at 25, signaling that selling pressure has overpowered the buying pressure.
Bitcoin Cash (BCH/USD)
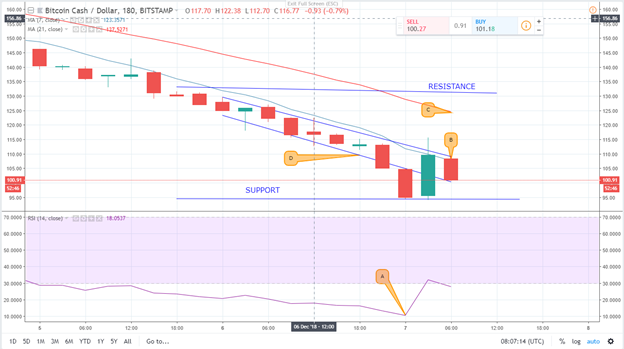
Bitcoin Cash continues to take a beating in the post-fork period. Yesterday, it was trading at $128 before embarking on a downward spiral to the current exchange rate of $108 against the dollar. This represents a 15% loss for BCH.
Marked C and B are the 21 and the 7-day moving averages respectively. The 21 days EMA has been above the 7 days EMA over the last 24 hours indicating the heavy magnitude of the loss being experienced by BCH. Support has also dropped to below the $100 mark and is at $94 while resistance stands at $130. The highest point reached was $127 and $94 on the lower side.
A shows the RSI miles below the ‘oversold’ region. It is currently at 9, showing that there has been a negative attitude by investors towards BCH since the fork.


