

Bitcoin has continued the month of June on the strong foot. The number one ranked cryptocurrency is currently trading at a price of $7,686 and has a total market cap of $131 billion dollars.
Over the past 24 hour period, Bitcoin has experienced a 2.12% increase against the USD, at the time of writing, and has been fluctuating fiercely around the $7,750 region.
It certainly does look like the bulls are starting to enter back into the market, however, it is important to remain disciplined and to wait for the trend to confirm itself before committing to any positions.
BTC/USD Price Analysis
BTC/USD – Long Term – Daily Chart
https://www.tradingview.com/x/g5tpV4hh/
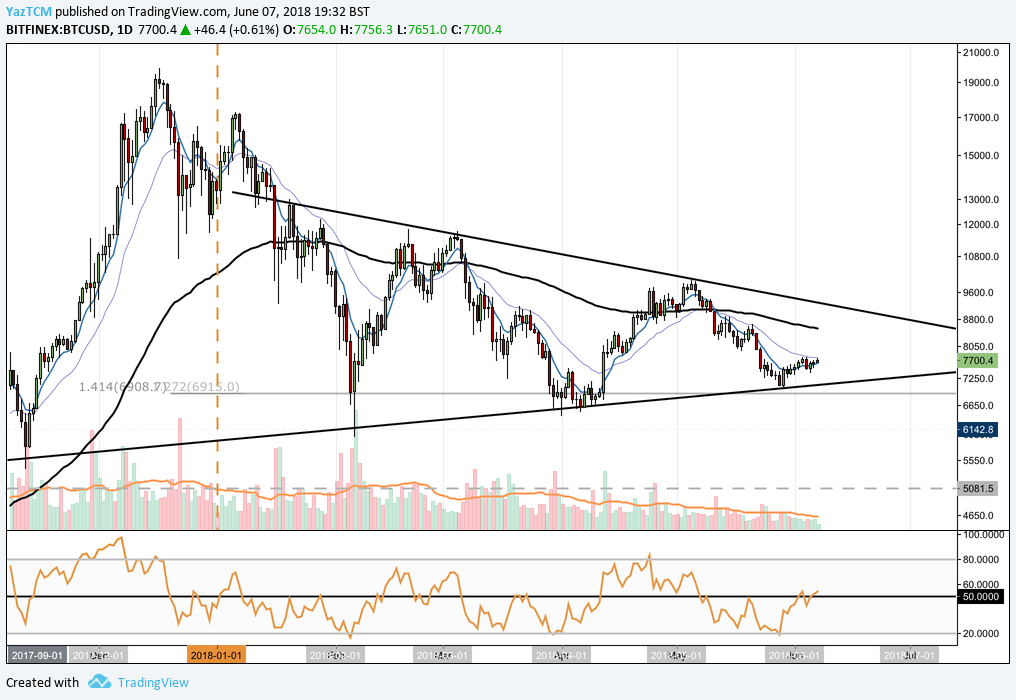
Not much has changed, from a long term perspective, since our last Bitcoin technical analysis article, here. Bitcoin is still trading within the confines of a long term symmetrical triangle. Price action has been trading within this triangle since mid January this year and has traded ever since as the apex approaches to resolve the triangle at some point during July.
The all time high for the year was set on January 5th at a price of $17,105 and the low for the year, according to BITFINEX market data, was set on February 5th at a price of $6,651. The current price of Bitcoin is significantly lower than the all time high. Specifically, Bitcoin is currently 55% off of the high set in early January. However, recent bullish momentum has started to hint that the worst of the consolidation may be over.
If the bullish momentum experienced at the start of the month can continue, we may see price action head on up toward the upper boundary of the triangle. From here, price action has an opportunity to make an attempt to break above the triangle which would in turn be the signal for a long term bullish trend within the Bitcoin market.
BTC/USD – Short Term – Daily Charts
https://www.tradingview.com/x/Ht8xBLSp/
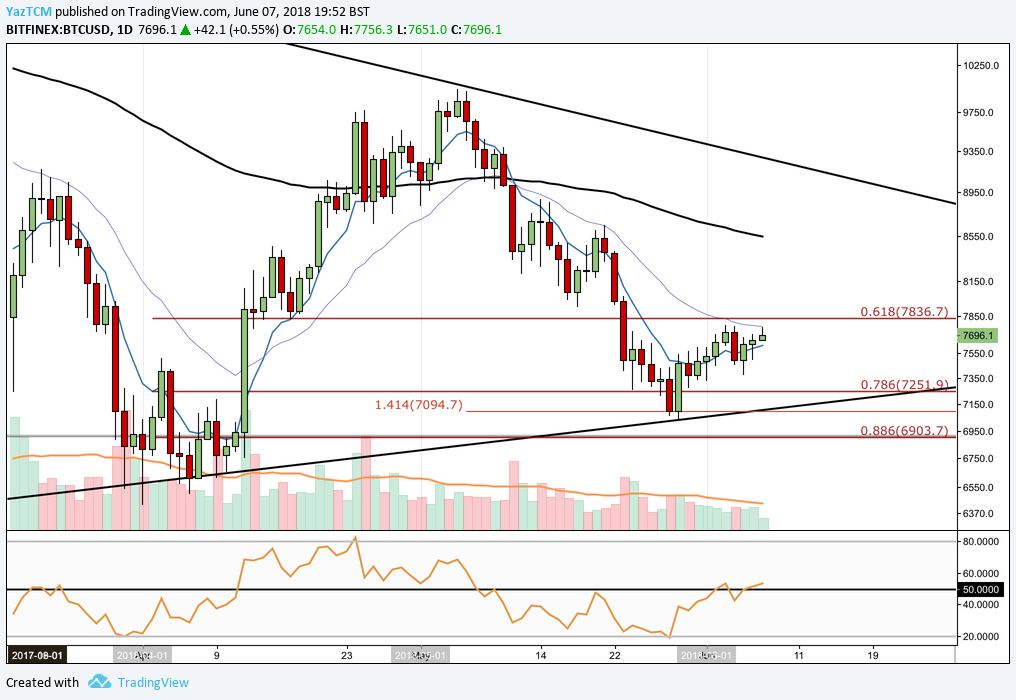
Taking a closer look at the market, we can see that Bitcoin had experienced a bearish month in May. However, as the month of June began the market shifted in momentum as the bulls stepped in and began to push price up. A bullish engulfing candle can be noted on the 29th of May to mark the initial signal to this momentum shift.
We can see that Bitcoin has retracted just past the .786 Fibonacci Retracement of the bullish swing seen in April, at a price of $7,251 where the market found support and rebounded. Price action is currently attempting to retest previous support, now turned resistance, seen at $7,826.
If price can break and hold above $7,826 then we could possibly see the bullish momentum continue throughout to the end of the month and possibly make an attempt at the upper boundary of the long term symmetrical triangle, we would expect this to be some time toward the end of June. A break above the triangle would be the initial signal that a long term change in trend could possibly be on the way.
The technical indicators are beginning to show promise that the bulls may be gaining strength in their fight against the bears. The RSI indicator has, once again, managed to break its way above the 50 handle.
We will have to monitor RSI closely over the next three or four trading days and see if it can hold above 50. The 7-day EMA and the 21-day EMA are also showing signs that they may be attempting to cross above one another soon as the shorter moving average begins to approach the longer moving average. If they can cross then this would show signs of positive momentum within the markets.
Conclusion
It is important to stay diligent when the long term markets are trading within range-bound conditions. For Bitcoin, the past 5 previous months have experienced alternating short term market trading conditions as short terms trends have changed from bullish to bearish (or vice versa) at the start of each month this year.
This type of long term trading condition provides ample trading opportunities in the short term but provides no fruit for potential long term holders.
Bitcoin is coiling as it consolidates toward the apex, a strong surge of volume would be needed but could June be the month that ends the misery seen in Bitcoin during 2018?


