
 Technical Analysis #003 - Bitcoin witnesses a strong start to the month but can price action hold_")
Bitcoin has experienced a strong start in trading for the month of June. Price has experienced a 2.55% increase over the previous 24-hour session, at the time of writing, and is showing promising signs that it may continue.
The total market cap of all coins combined has grown from $303 billion, the lows seen in May, to $342 billion in early June.
Bitcoin is currently exchanging hands around $7645 creating a solid foundation to build from for the month ahead.
Long Term Overview
https://www.tradingview.com/x/19er6yLB/
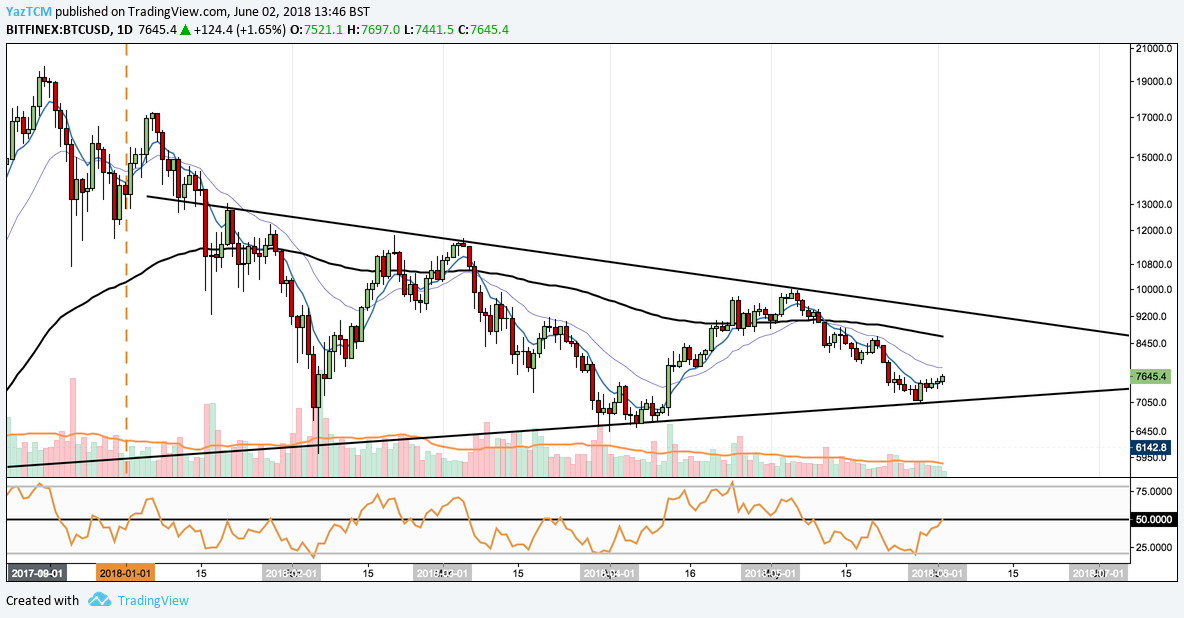
From a long term perspective, Bitcoin is still trading within the confines of the long term symmetrical triangle annotated in the chart above. We have been following the formation of this symmetrical triangle for some time and have covered this in our previous articles here and here.
We can see that May could not be considered a positive month for Bitcoin as price dropped from a high of $9990 to a low of $7040. However, price has shown some positive signs in recent trading sessions and is on course to begin another bullish month for Bitcoin.
For the market to be considered a bullish market we would first need to see an upside break of the triangle. From a technical analysts perspective, we could see the upside break happening at some point during the month of June as price action approaches the apex of the symmetrical triangle. Statistically, symmetrical triangles usually resolve themselves by breaking toward the upside which would benefit the bulls within the market.
Short Term Overview
Daily Chart
https://www.tradingview.com/x/rvlU128e/
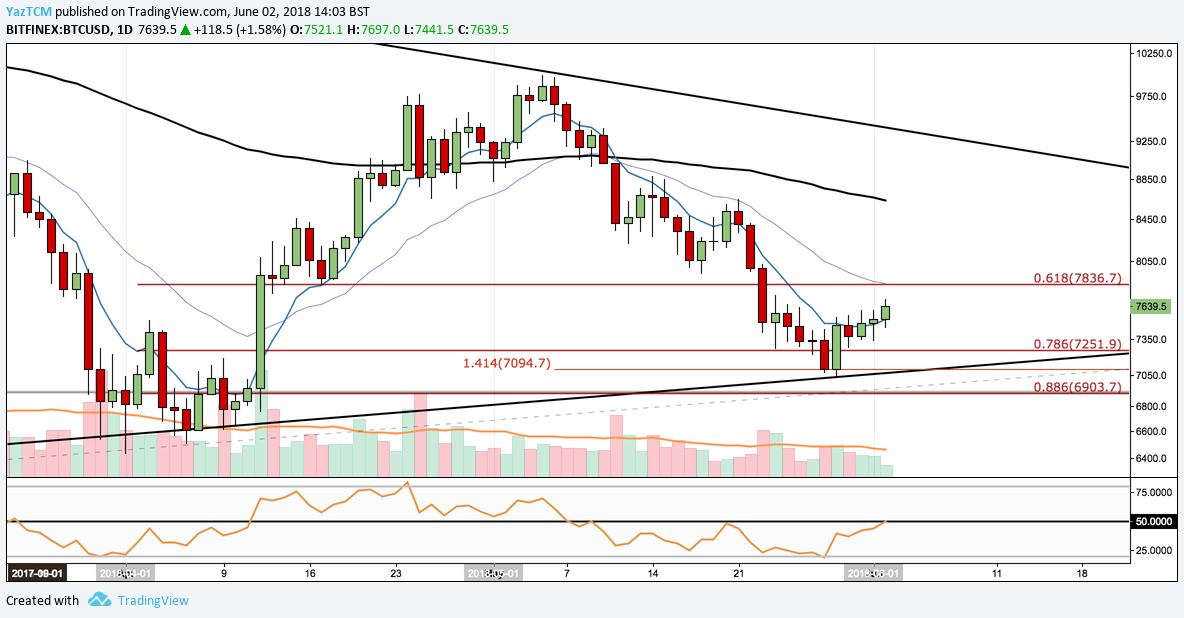
We can see that the market has started the month in the favour of the bulls. Price has broken above the .786 Fibonacci Retracement once more, discussed in previous articles, and is currently making its way to approach the .618 Fibonacci Retracement priced at $7836.
The bullish engulfing candlestick pattern that was formed on the May 29th trading session has proven to be a valid reversal pattern. Price is currently resting at $7640, up 9% from last months low at the formation of the bullish engulfing.
Price action may find some resistance as it approaches the .618 Fibonacci Retracement at $7836, as this level will also confluence with the 21-day EMA. If price action manages to break above the .618 Fibonacci Retracement then we could see it make its way up to the upper resistance boundary of the symmetrical triangle.
The technical indicators continue their battle to provide confirmation that Bitcoin could be within the course of a price reversal. The RSI is fighting the 50 level as it currently finds some resistance after reaching the level.
For bulls to get excited within the market, we would like to see RSI break and hold above 50. Price action is also trading above the 7-day EMA, a positive sign for the bulls. If the 7-day EMA can go on to cross the 21-day EMA this would provide further validation of Bitcoins price reversal.
4-Hr Chart
https://www.tradingview.com/x/an7SND9V/
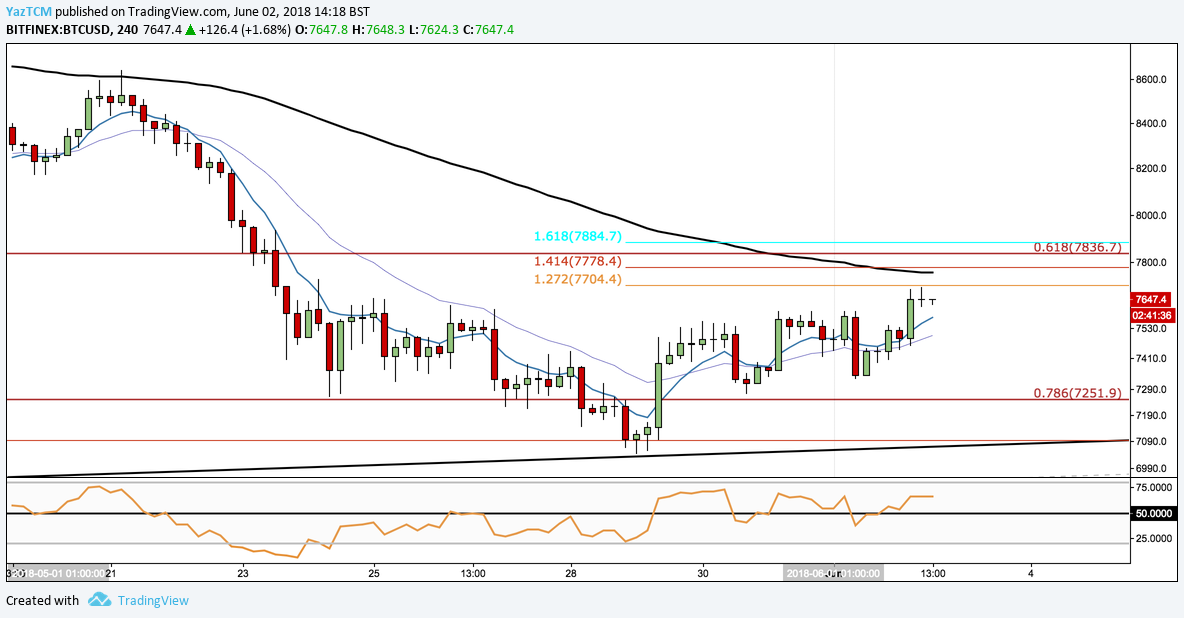
From the 4-hr chart above, we can see that BTC has gradually eased on its downside pressure over the past few trading sessions.
The 1.414 downside Fibonacci Extension, at price $7094, mentioned in our previous analysis has continued to hold. Price action has continued a steady slow price rise and has found a brief moment of resistance at the upside 1.272 Fibonacci Extension level at $7704.
If price manages to break above $7704 we could expect price action to make its way up toward the previous .618 Fibonacci Retracement at $7836. Alternatively, if this reversal proves to only a short-term act, price action could head back toward the .786 Fibonacci Retracement located at $7251 before continuing lower to retest May’s low.
The short term EMAs have crossed above each other providing a signal for a potential short term bull run and RSI has managed to stay consistently above the 50 level indicating positive momentum within the market.


