Bitcoin has finally enjoyed a few consecutive days of rising prices this month. BTC has enjoyed a price hike of 3.57% over the past 24 hours. The cryptocurrency is currently exchanging hands round $7,760, at the time of writing and has enjoyed a surge of 15.70% in price over the past 7 trading days.
Bitcoin is currently the number 1 ranked cryptocurrency in terms of overall market cap across the entire industry, with a total market cap value of $132.80 billion. Although Bitcoin has enjoyed a 27.05% increase in price over the past 30 trading days it still has much losses to recover. Bitcoin is still currently down around $33 billion from its recent market cap high of $168 billion seen on the 5th of May 2018.
Let u continue to analyse price action for Bitcoin over the long term.
Price Analysis
BTC/USD – LONG TERM – DAILY CHART
https://www.tradingview.com/x/sddrYT7j/

Analysing the market from the long term perspective above, we can see that the market had experienced a significant bullish run when price action rose from a low of $2,980 on the 15th September 2017 and extended to a high of $19,891 on the 17th of December 2017. This was a remarkable price increase of 570% from low to high.
The market went on to decline after placing its all time high, largely staying above the .786 Fibonacci Retracement priced at $6,622 for the majority of the year. This Fibonacci Retracement is taken from the entire bullish run outlined above.
We can also notice how price action has largely remained in the confines of the descending triangle pattern outlined above. Although the base of the triangle has been slightly adjusted since our last analysis, the entire descending triangle pattern is still in play.
We can notice that price action has recently just poked above the upper boundary of the descending triangle. If the market can stay above this level, it could serve as an initial signal that a long term bullish trend may be in formation.
Let us continue to analyse price action over the shorter period to highlight any potential support and resistance areas in the near term.
BTC/USD – SHORT TERM – DAILY CHART
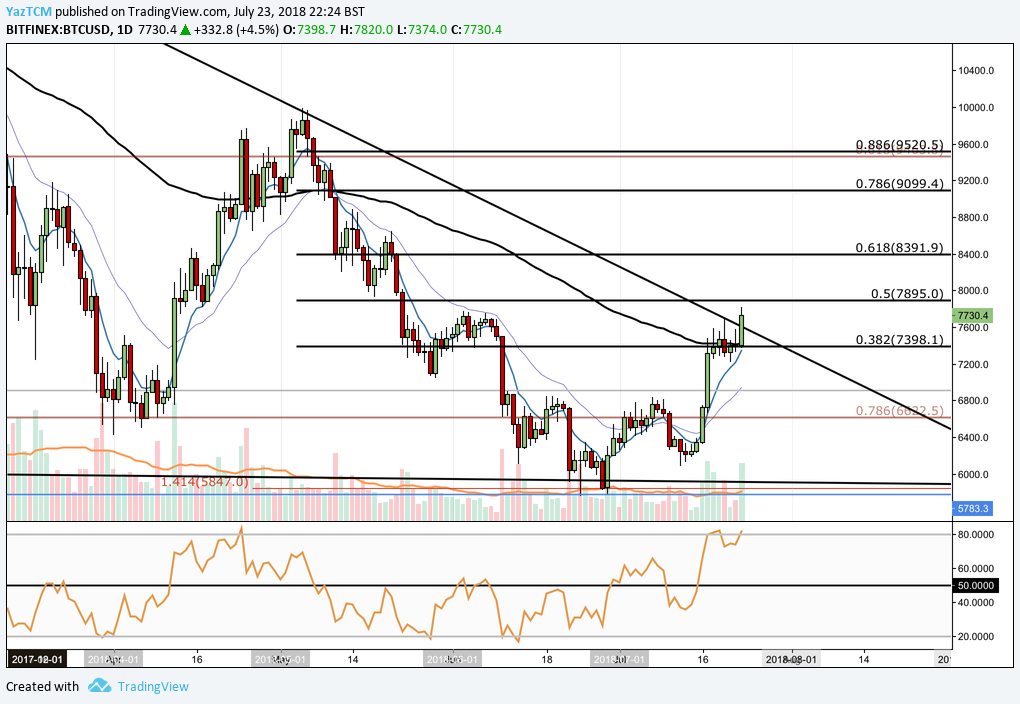
https://www.tradingview.com/x/5lRTk08k/

Analysing the market from the benefit of a smaller time frame, we can see that the recent bullish momentum that caused price action to break above the upper boundary of the descending triangle has also caused price action to break above the 100 day moving average.
Price action has stayed below the 100 day moving average for the majority of the year. The last time price action managed to poke above the 100 day moving average was back during the April bullish run when price action rose from a low of around $6600 and extended to a high close to $10,000. However, the market failed to stay above this 100 day moving average for very long and plummeted below it once again after a short two week period.
The recent bullish momentum has also pushed price action above a bearish .382 Fibonacci Retracement resistance level priced at $7398. This is a bearish Fibonacci Retracement measured from the high seen on the 5th of May at $9,990 to the low of $5783 witnessed on the 29th of June.
If the bullish momentum can continue within the market, we can expect near term resistance to be located at $7,895 and $8,391 which are the bearish .5 and .618 Fibonacci Retracements respectively.
Alternatively, if the market recedes and fails to close above the upper boundary of the descending triangle then we can expect near term support to come in at the bearish .382 FIbonacci Retracement level priced at $7,398. This are of support is also bolstered by the 100 day moving average.
The technical indicators are largely producing favour toward the bulls. The RSI is trading well above the 50 handle at oversold conditions at 80. This indicates that the bullish pressure is the dominating force within the market. So long as the RSI can maintain above the 50 handle, we can expect this bullish run to continue.


