
 Technical Analysis #004 - Bitcoin Falls 11% And Creates Fresh 2-Month Lows")
Bitcoin has experienced significant bearish pressure over the past trading session as price action breaks through the lower boundary of a 5 month old symmetrical triangle, breaking a long term technical pattern and creating new fresh two month lows.
Price is down, at the time of writing, a total of 6.67% over the past 24-hours of trading, at a price of $6,744, and down 10.10% over the past 7-days of trading.
Sunday June 10th was a bloody day for cryptocurrency across the entire group of cryptocurrencies as markets wiped out over $20 billion in overall market cap. It all began early Sunday morning as price action experienced some significant selling pressure through a 2 hour period between 12:00 and 01:00 (UTC+1) where prices dropped a total of 4.53%. Then at 18:00 (UTC+1) prices fell a further 7% from $7,202 to $7,600.
Although there has been no major news for Bitcoin, there has been rumours of an “Asian Whale” who has said to have accumulated close to 94,000 during early 2018 and has recently sent over 8000 BTC to the crypto exchange Huobi, presumably to be sold. This significant bearish pressure entering the market could not bode well for Bitocion’s price.
The steep decline in price action saw price break out of some long term technical patterns we have been following for a few months. Let us take a further look into price action over the past few months and examine where we are today.
Price Analysis
Long Term
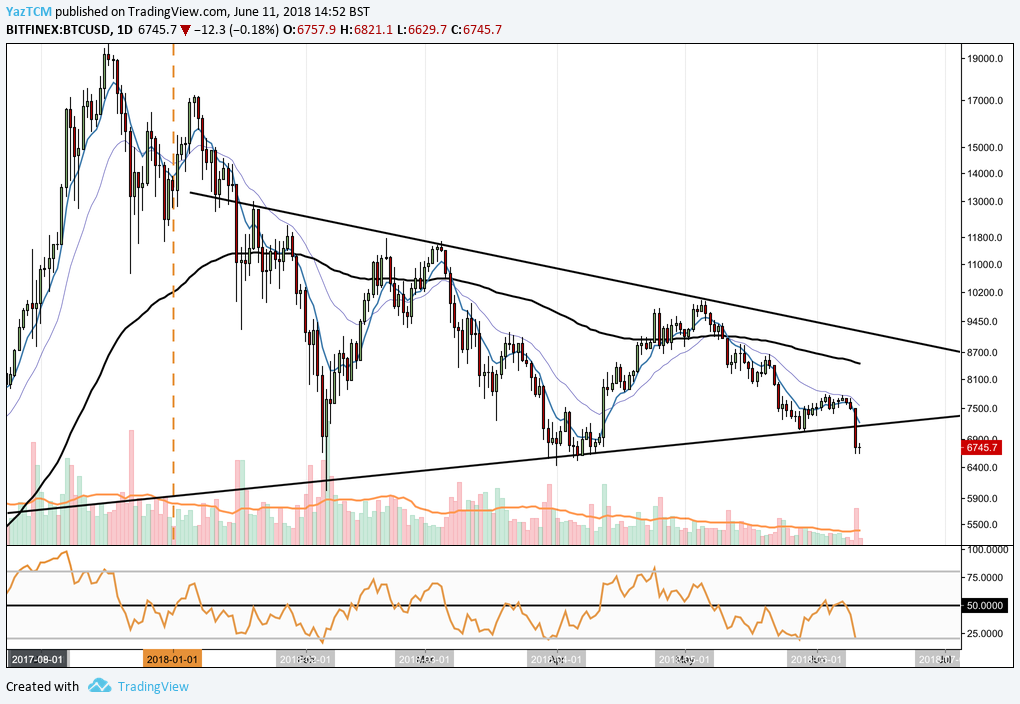
The sharp decline over the past 24-hours has seen price break through a long term symmetrical triangle we have been following over our past few reports. The break is shown in the chart below.
BTC/USD – DAILY CHART – LONG TERM 1
https://www.tradingview.com/x/KsdRbGoH/
Looking at the chart above, the close of the most recent candle has pushed price significantly below our symmetrical triangle and in turn, erasing its existence.
So where are we now then?
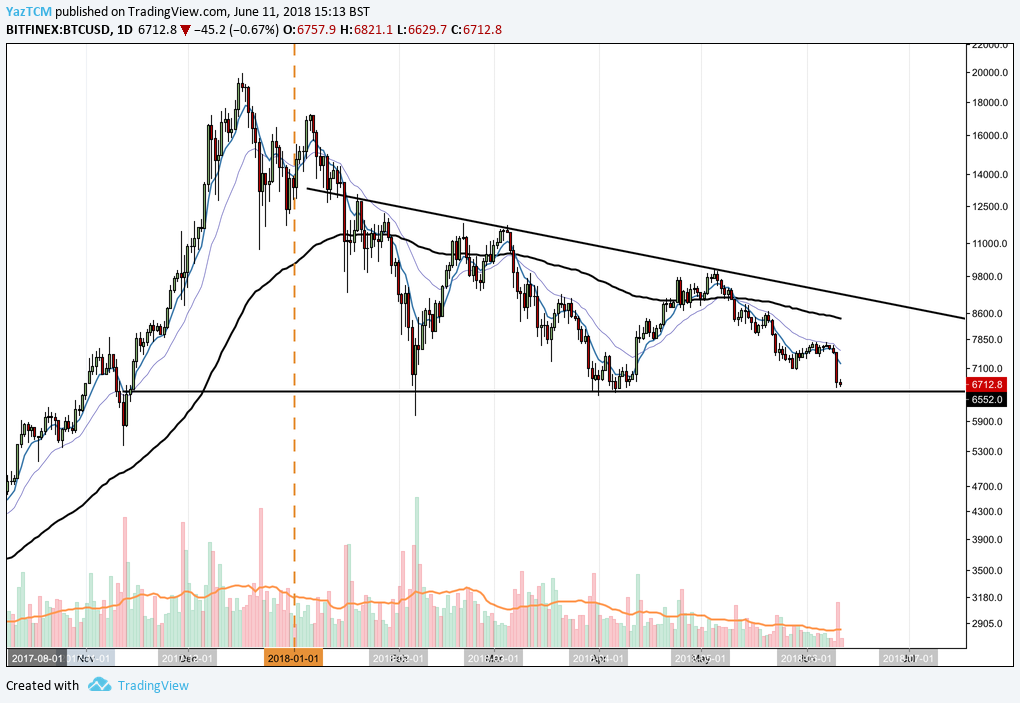
BTC/USD – DAILY CHART – LONG TERM 2
https://www.tradingview.com/x/KLEJzwlN/
From a long term perspective, we are now trading within the confines of a descending triangle. This triangle uses the same upper boundary as the previous triangle but now has a solid support base located at $6,500.
We can see that price action has currently found some support at the lower boundary of the descending triangle. If price action can hold at this lower boundary over the long term and rebound from here, then we may potentially see the market make an attempt at the upper boundary. This is unlikely until the bulls start to show some momentum within the market.
Alternatively, the market could drop through the lower boundary of the descending triangle. This would leave the market in free fall with the nearest level of support coming in at $6,000.
Short Term
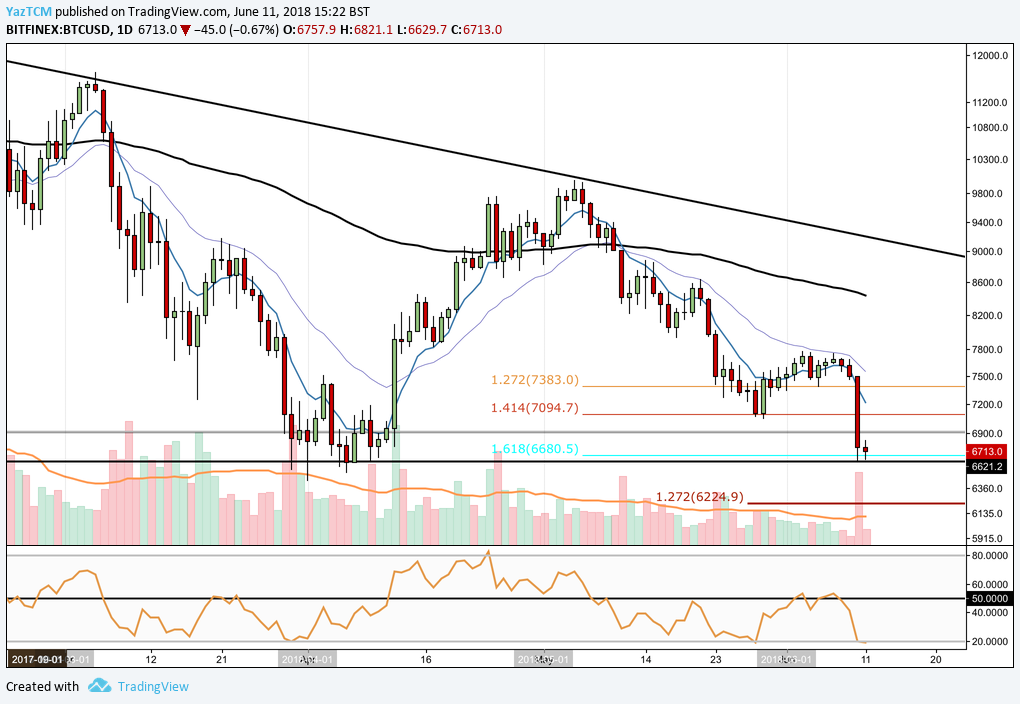
BTC/USD – DAILY CHART – SHORT TERM
https://www.tradingview.com/x/zPtNIxvu/
Looking at prices over the past 2 months, we can see that the bullish month in April was followed by a bearish month in May and now, June is an extension of the previous bearish month.
Price action has found support at a 1.618 Fibonacci Extension level, taken from the high seen in early May to the low seen during mid-May, at a price of $6,680.
We can also see that price action is approaching the lower boundary of the descending triangle (outlined above), where we have seen and should continue to expect to see some form of support.
Considering the momentum behind the recent bearish drop, it would not be surprising to see price action fall though the lower boundary of the symmetrical triangle. If this were to be the case, near term support would be located at $6,224 followed by $6,000. However, we are expecting price action to hold above the lower boundary of the descending triangle over the next few trading sessions.
The technical indicators are providing bias that heavily favours the bears within the market. The 7-day EMA and the 21-day EMA are pointing in the downward direction have pulled relatively far away from one another indicating the strong bearish pressure within the market.
To further add to this bearish sentiment, the RSI failed to stay above the 50 level and took a nosedive as it now trades oversold conditions. This could be considered a positive sign for the bulls as the RSI does not tend to trade within extreme oversold territory for very long. Analysing the current chart, we can expect the RSI to remain in bearish territory for the next week of trading sessions, at the very least.
CONCLUSIONS
Price action has suffered a lot of bearish pressure over the past few months as it falls from the highs placed in January. Price action is now currently trading below the lows seen in May creating a new 2-month low.
Can price action find enough support at the lower boundary of the descending triangle to create a concrete bullish shift in price action for the Bitcoin bulls, or will price action break below the triangle and head toward the $6,000 mark? The market will answer all questions over the next few days.


