
![Bitcoin [BTC] Price Analysis for October week 3](https://zycrypto.com/wp-content/uploads/2018/10/Bitcoin-BTC-Price-Analysis-for-October-week-3.png "Bitcoin [BTC] Price Analysis for October week 3")
The pair was dominated by a bearish trend before embarking on a slow dip. It was attributed to tax avoidance due to an impending requirement to file tax returns on BTC. Investors looked to make quick sales ahead of the deadline.
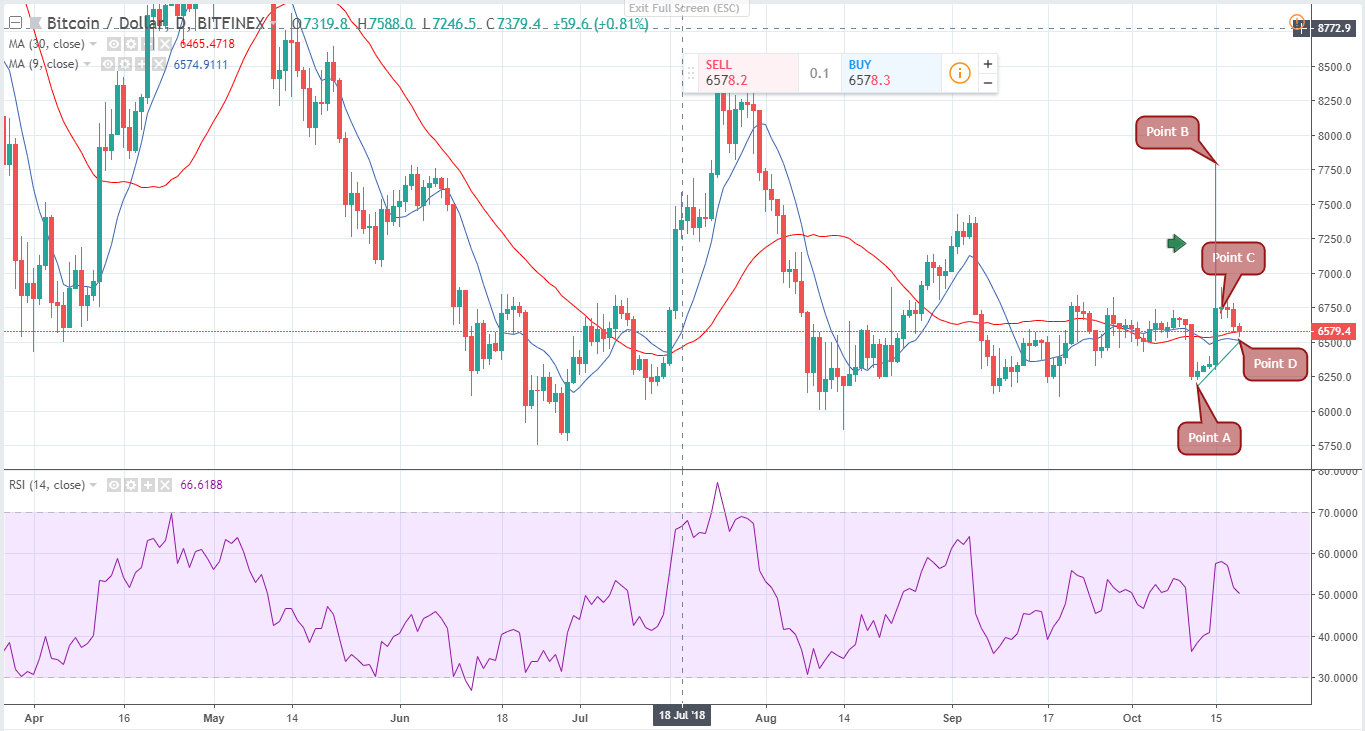
Throughout the week, prices oscillated between the $6,200 mark (as seen between Point A and Point C) and the $6,800 mark apart from October 15 (Point B) when the resistance level was breached to a new month-high of $7788.
Summary
- Generally a bullish trajectory, breaking the $6,600 support to a high of $7780 before taking a slow dip to a new low of $6582.
- The pair registered a 20% gain within the week.
- Support lay at around the $6,600 mark and resistance at $6800, breaking the psychological support level on October 17 due to mass sell offs of BTC. (Point B)
- If the bearish trend continues, chart patterns indicate support levels are likely to come to $6,200.
The chart
The pair gained 18% in the first half of the week and took a nose dive in the last half, taking a slight 2% loss. This is following a dead-cat bounce experienced at the end of the previous week. Chart patterns for the BTC/USD on October 15 indicated a price rally that seemed to indicate a break from the $6,600 support level.
IRS tax return on Bitcoin
On October 17 however, a dip in the pair’s price occurred. It was attributed to the impending IRS requirement to file returns on tax. Earlier in 2014, the regulator had categorized digital tokens including BTC as ‘property’ as opposed to ‘currency’. In order to avert incurring taxes on the digital tokens, BTC holders made quick sell offs consequently leading to the dip in prices.
The week, having kicked off on a bullish trend, seemed to inspire optimism to investors only to dampen their hopes as was seen with the 9 day and 30 day EMAs. The 9 day moving average crossed over the 30 day moving average on October 15 signaling a bullish trend (on one day charts). The 9 day EMA acted as the support level for the bullish trend.
 Long Positions at All-Time High Yet Price Remains Stagnant")
, and Stellar (XLM) Price Analysis – Recovery Expected Above Major Support Levels")
 and Stellar (XLM) Weekly Price Performance Overview")