
 Price Analysis Currency Looks Set For A Bull Run, Can it Break Above $4K")
BTCUSD Medium-term Trend: Bullish
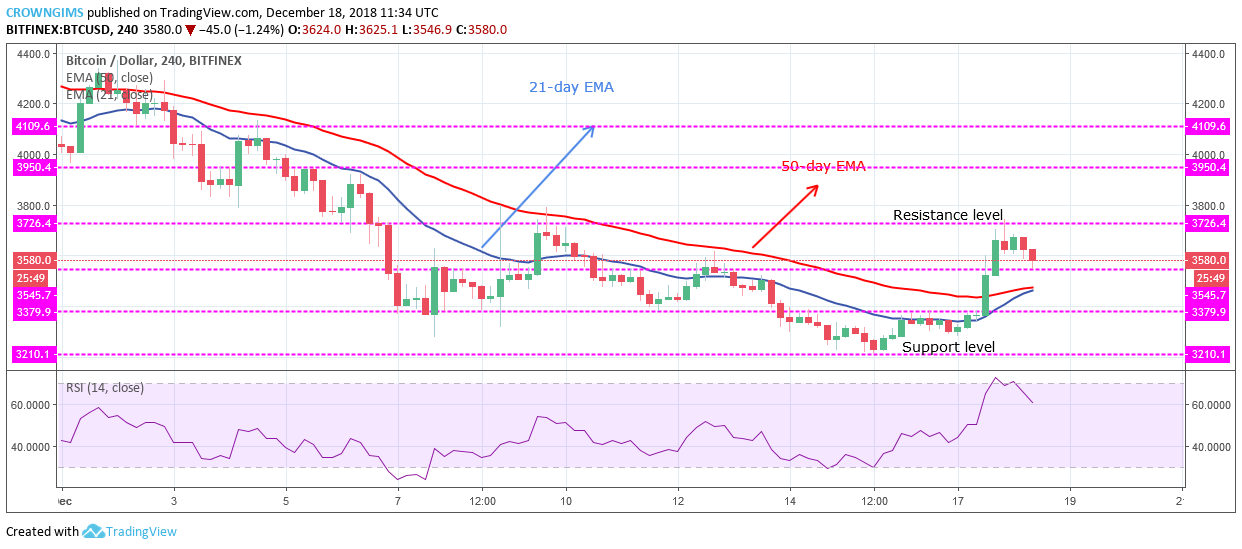
Resistance levels: $3,726, $3,950, $4,109
Support levels: $3,545, $3,379, $3,210
The cryptocurrency is bullish on the medium-term outlook. Several attempts were made by the bulls on the BTC market to reverse the trend but always rejected at the dynamic support and resistance level. An instance of scenario, on December 9, the coin was pushed up, broke the former resistance level of $3,545 and rallied towards $3,726 price level. It was returned to the previous low by the formation of bearish pin bar and BTC price further declined and bottomed at $3,210 on December 15.
A “tweezer bottom” candle pattern formed at $3,210 price level reversed the trend, the bulls gained momentum, broke up the former resistance levels of $3,379 and $3,545, a further increase was rejected at $3,726. Currently, the coin is carrying out price retracement.

The 21-day EMA is making an attempt to cross the 50-day EMA upside if the former crosses the later, it connotes that the trend changing to bullish. BTC price is already above the 50-day EMA which indicates that the bulls have gained momentum to change the trend. The Relative Strength Index period 14 is at 60 levels pointing down indicates sell signal which may be a pullback to retest the broken level before it continues an uptrend.
BTCUSD Short-term Trend: Bullish
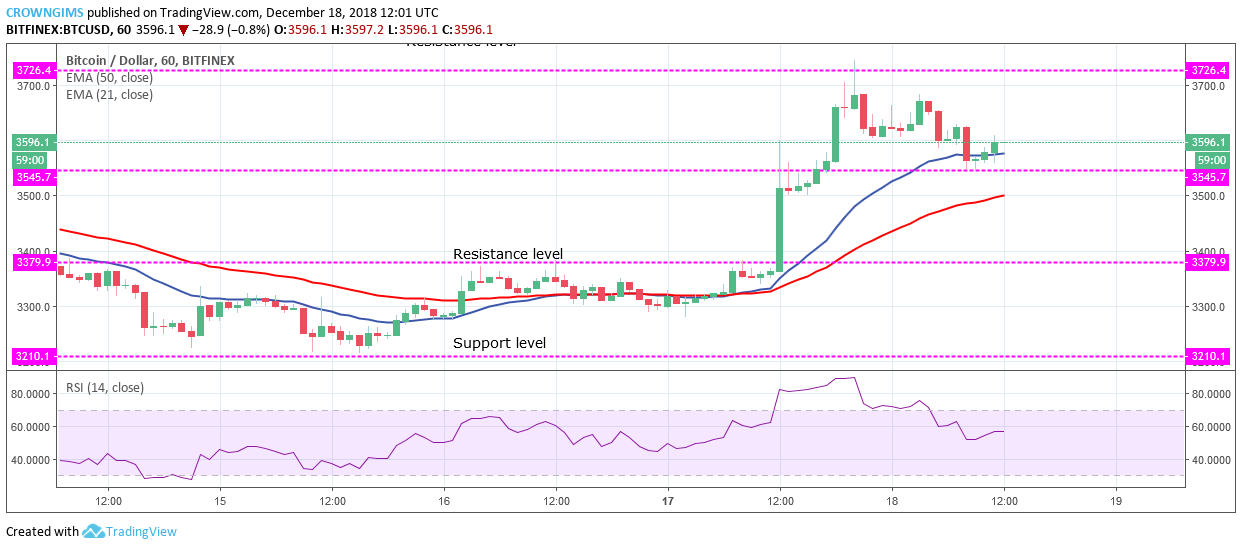
BTC/USD is bullish on the short-term outlook. BTC was range-bound within the resistance level of $3,379 and the support level of $3,210 since December 13 up till yesterday. The strong and massive bullish candle formed signaled the bulls’ momentum on the market. BTC price rallied to the north and topped at $3,726 price level after broken some barriers.
The 21-day EMA has crossed the 50-day EMA with the coin trading above the two EMAs which connotes bullish trend. The coin has retested the broken level. BTC/USD may continue its bullish trend as more bullish candles are emerging and the Relative Strength Index period 14 is above 55 pointing to the north indicates a buy signal.
 Long Positions at All-Time High Yet Price Remains Stagnant")
, and Stellar (XLM) Price Analysis – Recovery Expected Above Major Support Levels")
 and Stellar (XLM) Weekly Price Performance Overview")