
 Price Analysis Currency Could Recover Above $6,400")
Resistance levels: $6,356, $6,439, $6,744
Support levels: $6,286, $6,236, $6,204
BTC/USD Medium-term Trend: Ranging
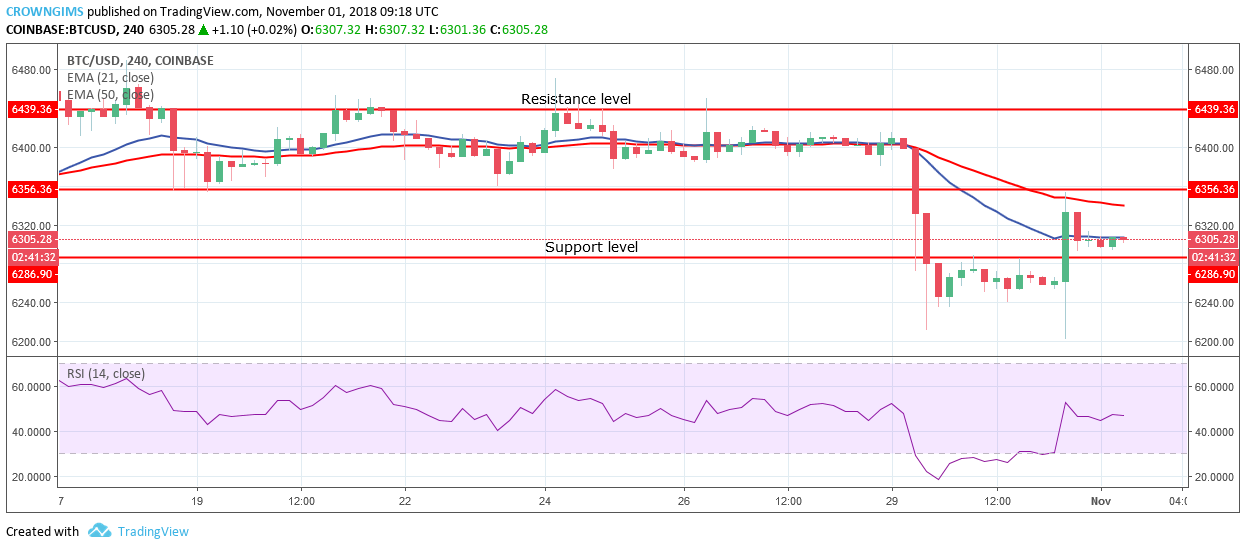
BTC/USD is in its ranging trend on the 4-Hour chart. The coin has been consolidating for more than two weeks within the bound range of resistance level of $6,439 and the support level of $6,356. On October 29, the bears gathered enough momentum and broke the support levels of $6,356 and $6,286 and exposed the lower support level of $6,236.
Yesterday, the bulls pushed up the BTC price, broke the resistance level of $6,286 up towards the resistance level of $6,356 where it was rejected by the formation of bearish inside bar candle that brought it back to the support level of $6,286.
For the BTC price to rally to the north, the bulls have to gather enough momentum to break the resistance level of $6,356 which will expose the coin to $6,439. In the same vein, the bears have to get more pressure and maintain it before the BTC price can be pushed to the south.
The 21-day EMA has fully crossed 50-day EMA and the two EMAs are fanned apart with the coin below the two EMAs which indicate the downtrend signal. The break out either to the south or north is imminent, traders should be patience.

BTCUSD Short-term Trend: Ranging
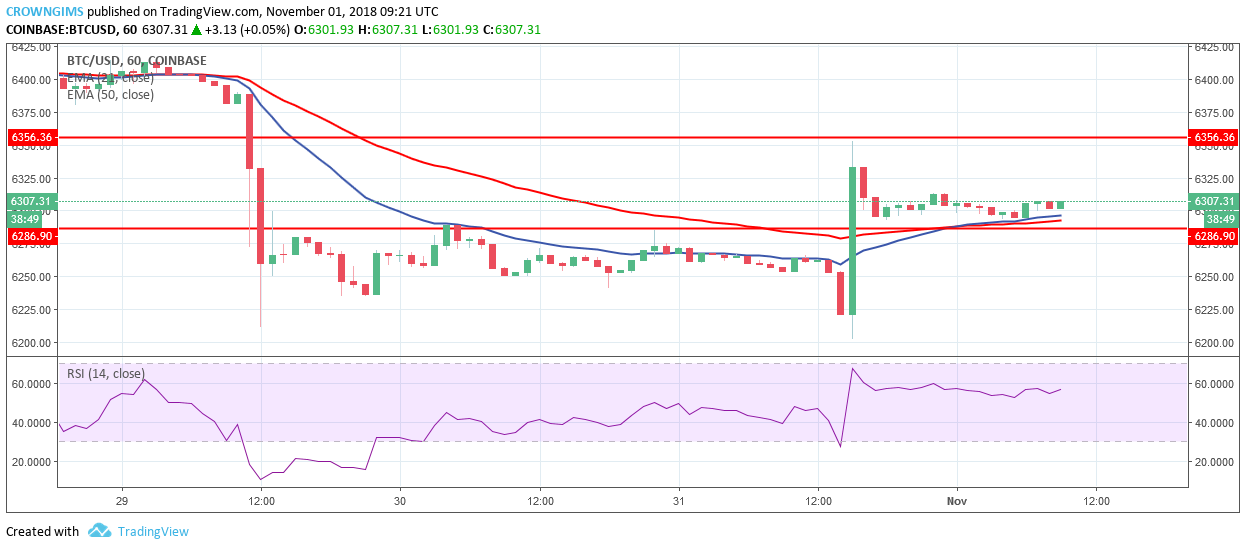
BTCUSD is ranging in its short-term outlook. Yesterday, there was a formation of bullish engulfing candle that propelled the BTC price to the north and broke the former resistance of $286 upside. Further BTC price increase was terminated by the Bears’ pressure at the resistance level of$6,356 and consolidation commenced at the $6,286 price level.
The two EMAs are closed and crossed with the coins directly on top indicates consolidation is ongoing. Meanwhile, the Relative Strength Index period 14 is below 50 levels and its signal line parallel without direction confirm consolidation in the BTC market.
 Long Positions at All-Time High Yet Price Remains Stagnant")

