Sees Resistance at February 2018 Price Low; Can the Bulls Keep the RSI Above the 50 Handle")
Tron has seen a small price drop totalling 3.19% over the past 24 hours of trading. The cryptocurrency is currently exchanging hands at a price of $0.0228 after seeing a remarkable 20.48% price increase over the past 7 trading days.
Tron has been gaining headline attention over the past few months starting with the launch of the Tron Virtual Machine (TVM). The TVM will allow developers to come and code smart contract enabled decentralised applications, similar to Ethereum, that are run upon the Tron Blockchain. Justin Sun had recently stated on Twitter that the Tron Blockchain is much more suitable to dApps than Ethereum is.
Tron continued on by announcing the acquisition of BitTorrent, the largest Torrenting client with over 100 million users. This has led to uTorrent, one of BitTorrents subsidiaries, to becoming a Super Representative that will maintain the Tron Blockchain recently.
Tron is currently ranked in 13th position in terms of overall market cap across the entire industry. It has a total market cap value of $1.50 billion after the cryptocurrency suffers a 39% price decline over the past 90 trading days. Tron is currently trading at a price that is 91% lower than the all time high value.
Let us continue to analyse price action for Tron over the short term and update our potential support and resistance zones.
Price Analysis
TRX/USD – SHORT TERM – DAILY CHART
https://www.tradingview.com/x/lH7t8iVN/
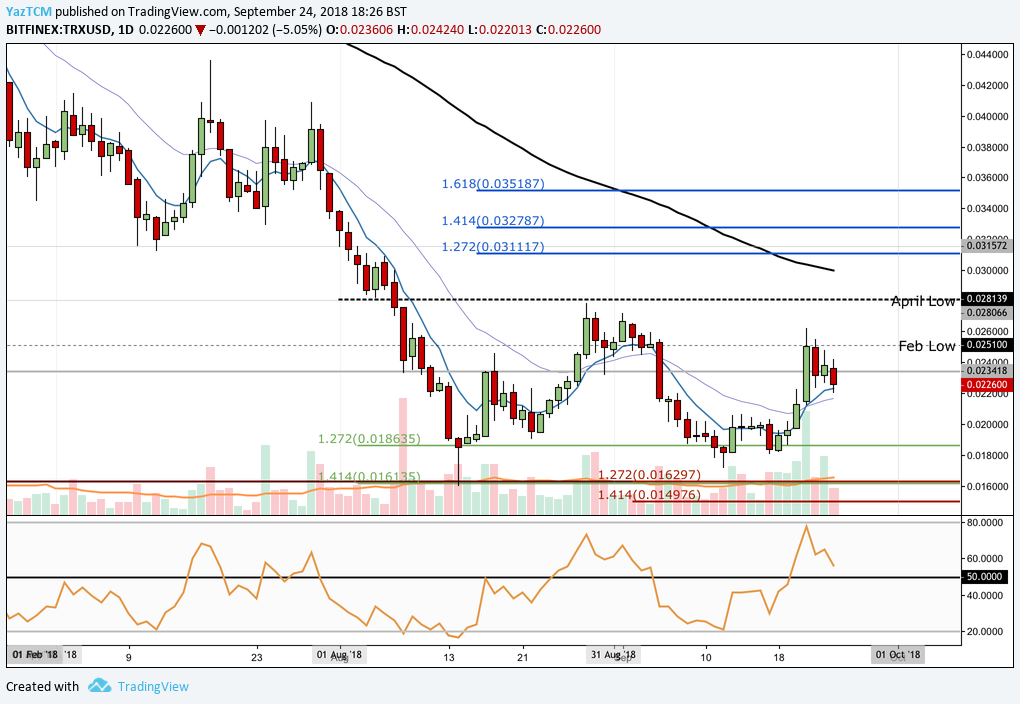
Analysing the market from the short term perspective above, we can see that price action had retraced after our previous technical analysis article. Price action continued to fall until finding support at the downside 1.272 FIbonacci Extension level (drawn in green) priced at $0.01863 during mid-September 2018.
Price action triple bottomed at this support level and rebounded during the course of last week. We can see that the market rallied up into hitting resistance at the February 2018 low price at $0.02510 before rolling over and declining slightly to where the market is currently trading around $0.022.
Moving forward, if the bears continue to push price action lower we expect immediate support located below the market to be found at the psychological round number handle of $0.020. Further support expected below can then be located at the downside 1.272 FIbonacci Extension level (drawn in green) priced at $0.018.
If the bears can continue to push price action below the $0.018 handle then the next level of significant support located below can be expected at the downside 1.414 Fibonacci Extension level priced at $0.01635. We can see that this are of support is significantly bolstered by long term support and another shorter termed downside 1.272 Fibonacci Extension level (drawn in red).
ALternatively, if the bulls can regather momentum at this area and push price action higher, we can expect immediate resistance to be located at the February 2018 low priced at $0.02510. Further resistance above this can then be expected at the April 2018 low priced at $0.02813 followed by the 100 day moving average which is currently hovering around the $0.03 handle.
The technical indicators within the market are currently heavily favouring the bulls at this moment in time. The RSI is trading above the 50 handle indicating that the bulls are in possession of the momentum within the market, however, the RSI is descending indicating that the bullish momentum may be fading. If the RSI can remain above the 50 handle we can expect this market to continue to make further gains.
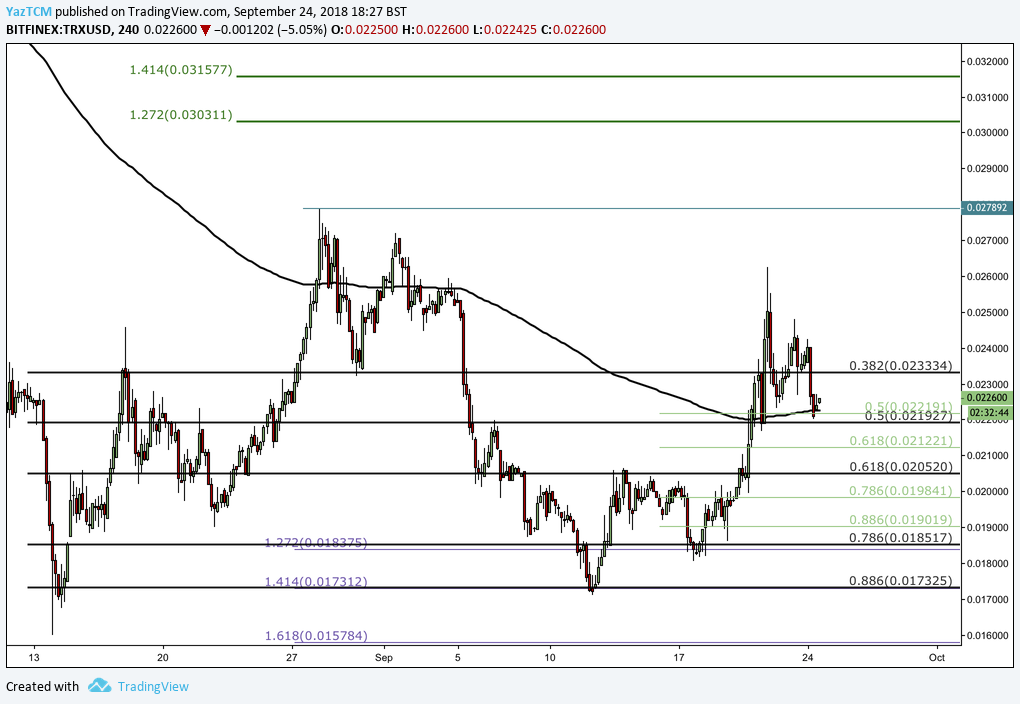
TRX/USD – SHORT TERM – 4HR CHART
https://www.tradingview.com/x/umAQFS2j/