

BTCUSD Medium-term Trend: Bearish
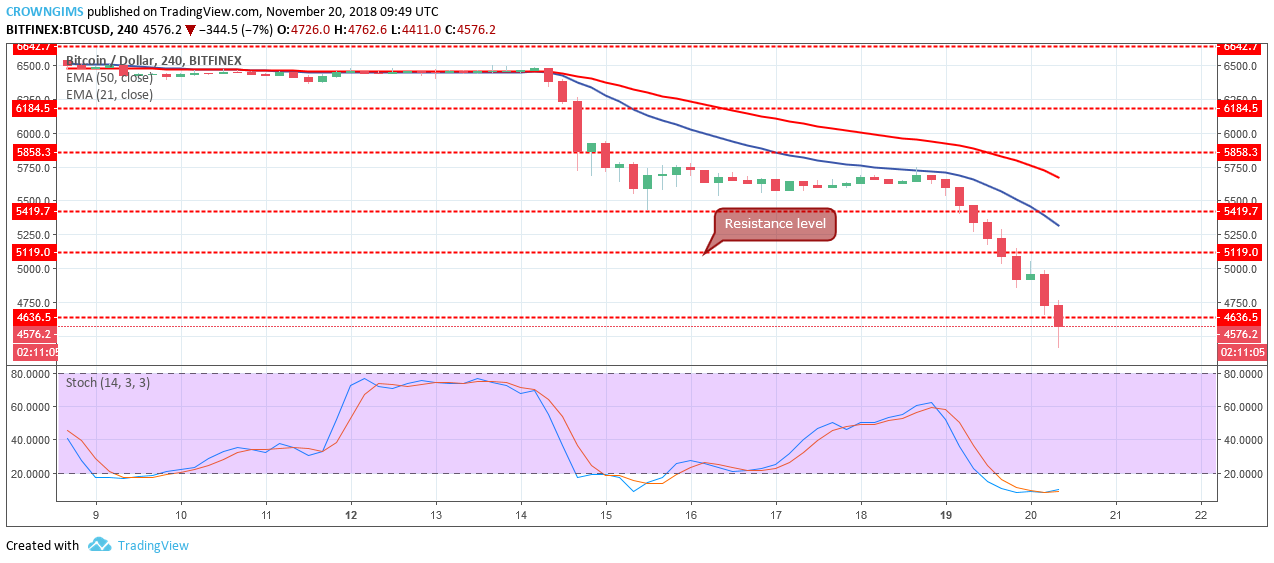
Resistance levels: $4,636, $5,119, $5,419,
Support levels: $4,207, $3,768, $3,025
BTC continues its downtrend on medium-term outlook. The cryptocurrency was range-bound between $5,858 and $5,419 price levels started on November 15. The upward movement was equally resisted by the dynamic resistance of 21-day EMA on November 18. That was what gave the bears opportunity to push the BTC price downside to break the price levels of $5,419, $5,119, $4,636. The BTC price is currently exposed to support level of $4,636.
The price of Bitcoin is below the 21-day EMA and the 50-day EMA indicating that the price may likely continue falling today. Meanwhile, the Stochastic Oscillator is below 20 levels which is oversold level indicating that the bearish momentum is strong. BTC price may test the support level of $4,207 as it has recently broken the $4,636 price level.

BTCUSD Short-term Trend: Bearish
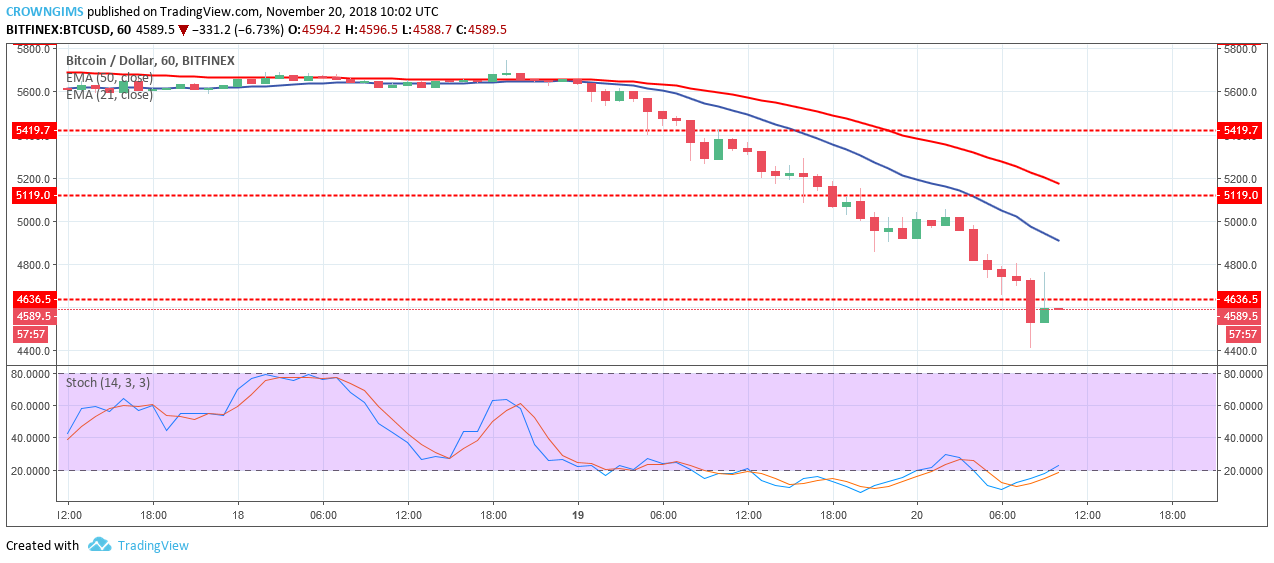
The bears were able to gain momentum that pushed the price out from the consolidation phase on November 19. The bears took control of the market and the price going lower lows in the BTC market. The bears’ pressure broke downside the support levels of $5,419, $5,119, $4,636. As at the time of writing, the BTC price on the 1-Hour chart is pulling back or retesting the broken level of $4,636.
BTC price is below the two EMAs indicating a bearish trend, however, the Stochastic Oscillator is below 20 levels with its signal line pointing up which is a buying signal, it may be a pullback.
 Price Up 62% From Bottom, Can The Bulls See More Gains?")

