

The various cryptocurrencies continue on a slow southward surge. Little activity has been recorded on the hourly charts. Where an activity has been registered, the candlesticks turned red across major cryptocurrencies indicating more pressure downwards which could see support levels tested in the coming days.
BTC/USD chart
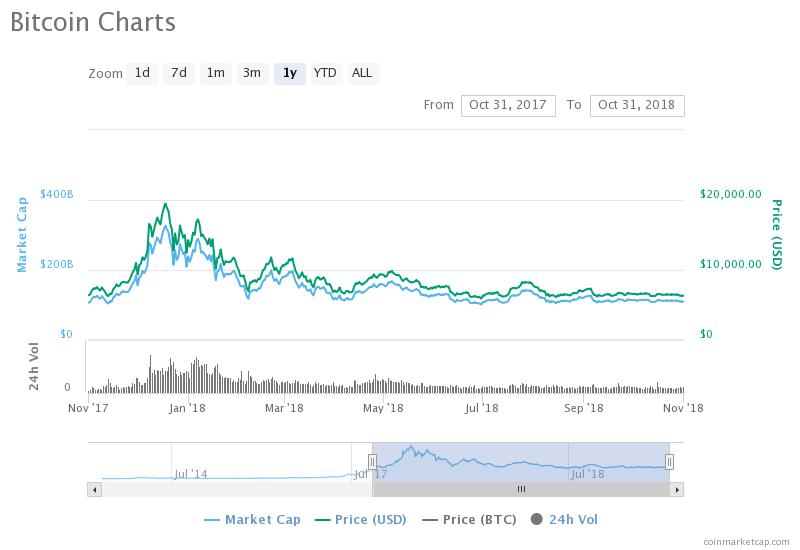
Bitcoin’s 10th Anniversary
Today marks Bitcoin’s 10th anniversary since it was created by Satoshi Nakamoto. Since yesterday when a bearish trend was recorded, it has not experienced any significant price movement. Its price fell to the $6300 price level with fluctuations commencing above that level.
The indices and the indicators are pointing in the same direction for the price which indicates a short-term bearish trend is to be expected. Currently, the price of Bitcoin is down by 0.09% from the opening price of $6330 to $6324 on one-hour charts. The latter current price is way below both the 12-day and the 26-day Moving averages which is an indicator of the strong bearish momentum.
At the moment, the bears have pushed resistance towards the $6310 mark on hourly charts. If the pair fails to stay above the $6250 support, a fresh decline towards the $6202 low. However, if the sellers remain in action, the price may even break the $6,202 low and trade towards the $6,150 level. On the flip side, a proper break above the flag resistance could push the price towards the $6,350 resistance.
Bitcoin Oversold
Additionally, the stochastic indicator is below 20, indicating that BTC has been oversold since yesterday, with a strong momentum southwards. The price of Bitcoin is expected to fall further and test the current support level which is $6200.

If the bears persist, the price may come to the $6,000 critical price mark and even breach it on the way down.
In the short term, more pressure at the latter support level may push it to $6000. The Relative Strength Indicator is at 26 showing that the market is oversold.
If the bulls can increase their momentum, a new price level beyond the $6300 level may be achieved in the near future. However, chart patterns indicate that it may be a struggle for the bitcoin’s attempts at correction above the $6300 level.


