

Supply zones: $0.497, $0.535, $0.564,
Demand zones: $0.455, $0.429, $0.400
XRP/USD Medium-term Trend: Ranging
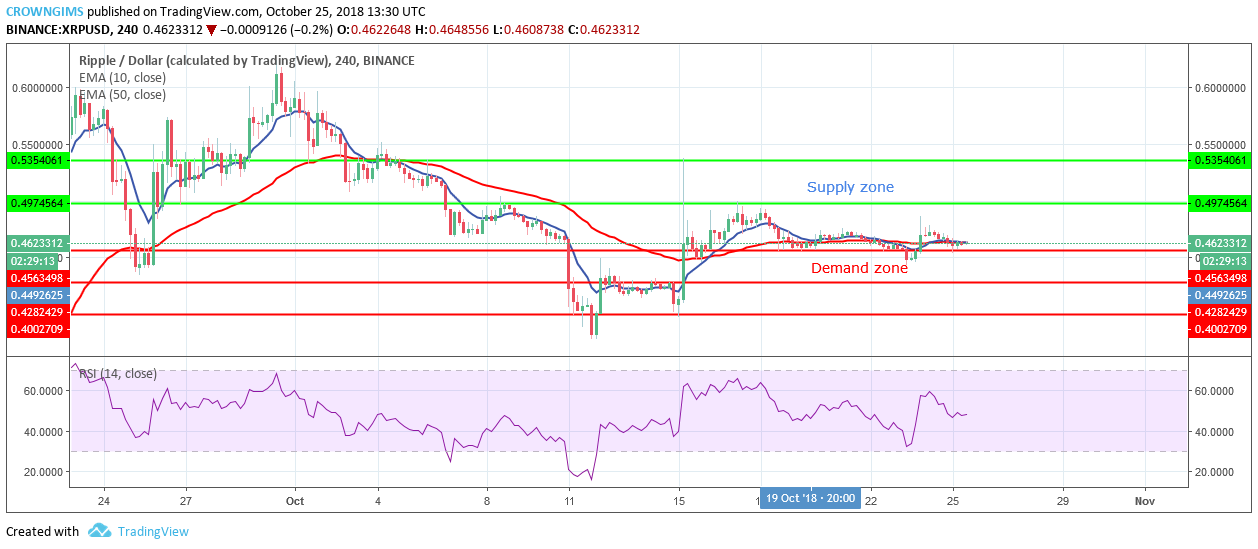
XRP/USD is ranging in its medium-term outlook. XRP rallied to the north on October 18 with high momentum from the bulls. It could not break out because of interference of the bears’ pressure that returned the XRP price to the demand zone of $0.455, and then it started consolidating on the demand zone of $0.455.
On October 23, the bulls tried to increase the price but the bears’ pressure prevailed. In case the demand zone of $0.455 hold, bulls will need higher momentum to move the XRP to the north, break the supply zone of $0.497 and find its high at the supply zone of $0.535.
Currently, XRP is moving on 10-day EMA and 50-day EMA, the two EMAs are twisted together confirming consolidation. The RSI period 14 is below 50 levels with its signal line pointing parallel to the level (showing no direction), which indicates consolidation is ongoing.
XRP/USD Short-term Trend: Bearish
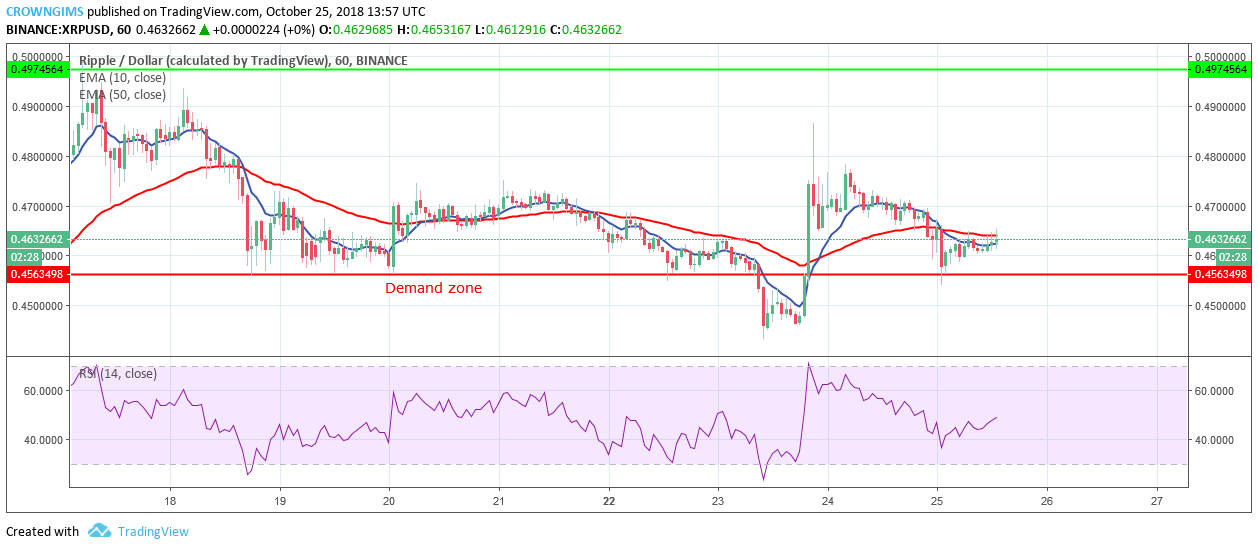
On the 1-Hour chart, XRP/USD has been in a bullish trend since October 23, when the pair rallied to the north by the formation of massive strong bullish candles, broke the supply zone of $0.455 and moved towards $0.497. The bears pushed it back with the formation of bearish pin bar. The bears took over the market and the XRP price was falling gradually.

The coin has been above the 10-day EMA and 50-day EMA all along which indicates an ongoing uptrend. But currently, the two EMAs are getting closer with the coin in-between the two EMAs, meaning that the price is falling and there may be changing of the trend soon. Nevertheless, RSI period 14 is above 40 levels with its signal line points to the north, which indicates the probability of price increase.
 Price Up 62% From Bottom, Can The Bulls See More Gains?")

