

XRP/USD Medium-term Trend: Bullish
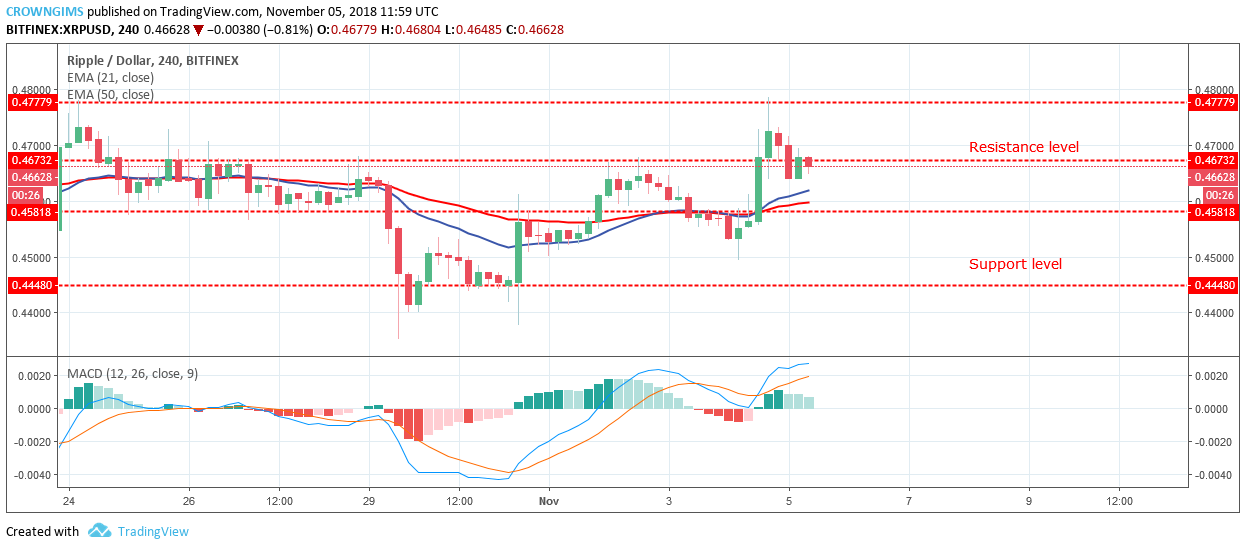
Resistance Levels: $0.46, $0.47, $ 0.48
Support Levels: $0.45, $0.44, $0.43
XRP was bullish yesterday on the medium-term outlook. The bulls took over the market shortly after the Doji candle formation at the support level of $0.45.
The bulls gained momentum and pushed the XRP price to break the resistance level of $0.46 and rallied to the upper resistance level of $0.47.
The price reversed by the bears’ pressure with the formation of inside bar bearish candle that pushes the coin below the resistance level of $0.46. The bearish trend the market is experiencing now could be a pullback to retest the broken level before the continuation of uptrend movement.
The dynamic support and resistance of 21-day EMA have crossed the 50-day EMA couple with the XRP price above the two EMAs confirm the bullish trend of XRP. In the same vein, the MACD line and the signal line are above the zero line which indicates a buy signal.
XRP/USD Short-term Trend: Bearish
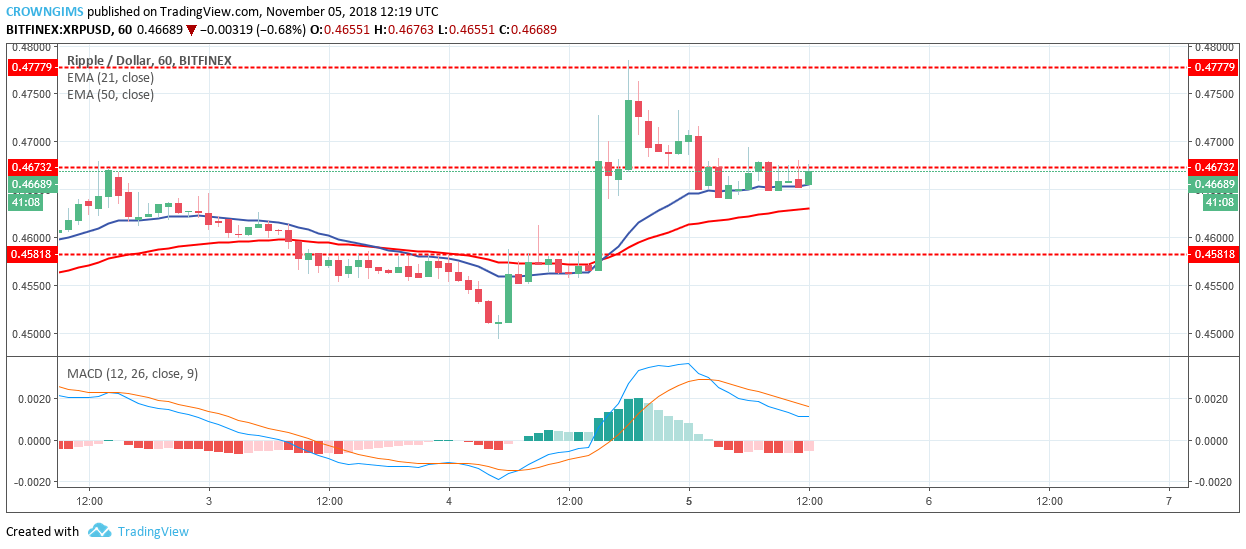
The cryptocurrency is bearish on the 1-Hour chart. The coin rallied to the north with the pressure from the bulls yesterday.

This is confirmed by the formation of massive strong bullish candle that broke the resistance levels of $0.45 and $0.46 targeted the upper resistance level of $0.47, the Bulls lose the pressure and the bears took over the market with the formation of bearish inside bar candle that pushed the XRP price below the resistance level of $0.46.
The 21-day EMA has crossed the 50-day EMA upside and the price is on the 21-day EMA and 50-day EMA with the MACD histogram that is below the zero line and the signal lines are pointing to the south which indicates a sell signal.


