Supply zones: $0.42, $0.46, $0.49
Demand zones: $0.39, $0.35, $0.32
XRP/USD Long-term Trend: Bearish

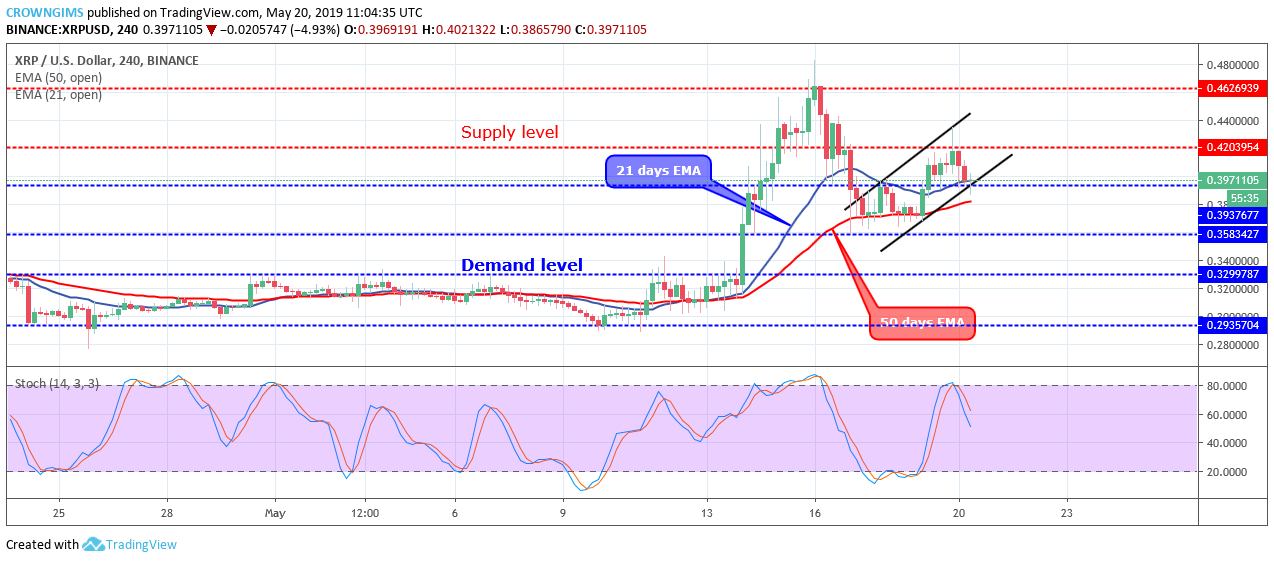
XRP/USD has been bearish on the 4-Hour chart. The bearish movement started May 16 when the Bulls’ momentum was lost at $0.46 level and the price had a rejection at the supply zone of $0.46. An inverted pin bar was formed at the level; which is a bearish reversal signal.
Right from that resistance level, 4-hour bearish candles were produced that penetrated the former demand levels of $0.42 and $0.39 and the price moved towards $0.35 but was supported by the dynamic support level of 50 periods EMA.
The price consolidated for more than twenty-four hours before the Bulls swim into action and the price pulled back to $0.42 level.
Today, the market opened with a bearish candle momentum that is pushing the XRP price down to break $0.39 level. The bears may push XRP price to break down $0.37 level and target $0.35 demand level.
In case the Bears lose their momentum, the XRP price may bounce at $0.39 level. The coin is about breaking down the 21 periods EMA and 50 periods EMA. Meanwhile, The Stochastic Oscillator period 14 is at 60 levels with the signal line pointing down to indicate a sell signal.
XRP/USD medium-term Trend: Bearish

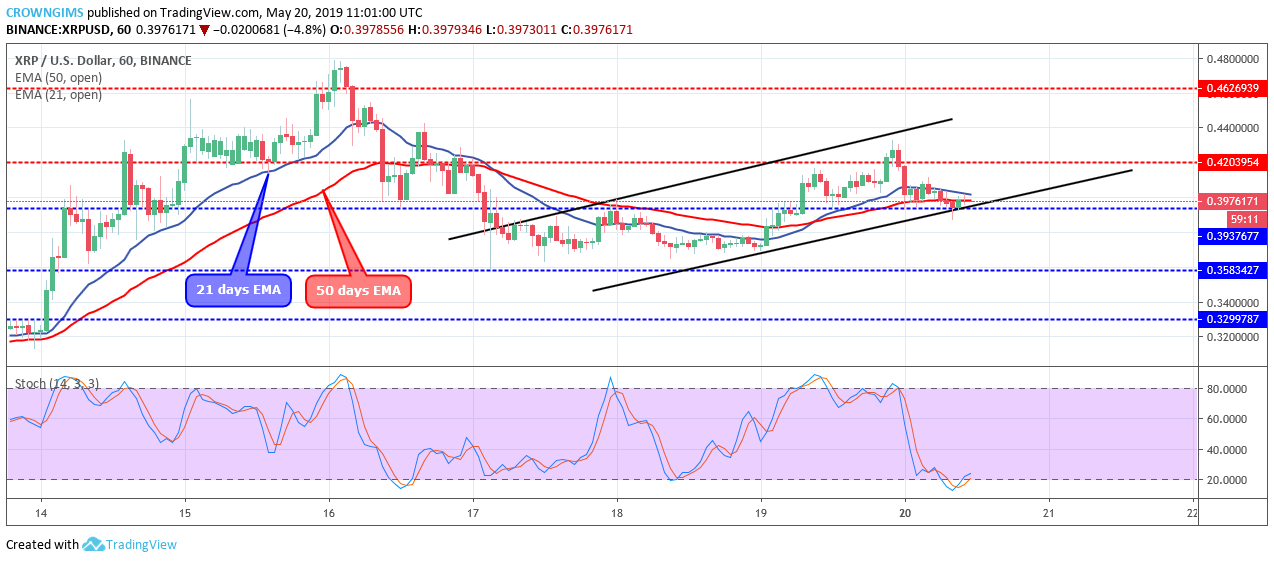
On the medium-term outlook, XRP/USD is Bearish. The Bulls were in charge of the XRP market last week. The bullish momentum placed the coin above the supply level of $0.42. On May 19, a bearish engulfing candle formed at $0.42 level; this triggered the bearish momentum and the XRP price started falling to the $0.39 level. As at the moment, the coin is consolidating at $0.38 level.
There is the probability that the coin may reverse at the level of $0.38 as the Stochastic Oscillator period 14 is at the 20 levels and the signal line points up to indicate a buy signal. The coin is hovering over the 21 periods EMA and 50 periods EMA, it indicates that consolidation is ongoing in the XRP market.


