

Tron has seen a 2% price increase over the past 24 hours of trading. The cryptocurrency is currently trading at a price of $0.025 after seeing a small 4% decline over the past 7 trading days.
Tron has experienced much coverage over the past few days as the Tron Virtual Machine launched on the 30th of August 2018. This TVM will allow developers to begin coding and developing within the Tron network, similar to the Ethereum virtual machine. It will allow for the building and execution of smart contracts upon the network.
Tron is currently ranked in 13th position in terms of overall market cap across the entire industry. IT has a total market cap value of $1.69 billion after suffering a 56% price decline over the past 90 trading days.
Let us continue to analyse price action for Tron over the short term.
Price Analysis
TRX/USD – SHORT TERM – DAILY CHART
https://www.tradingview.com/x/o1FrddlH/
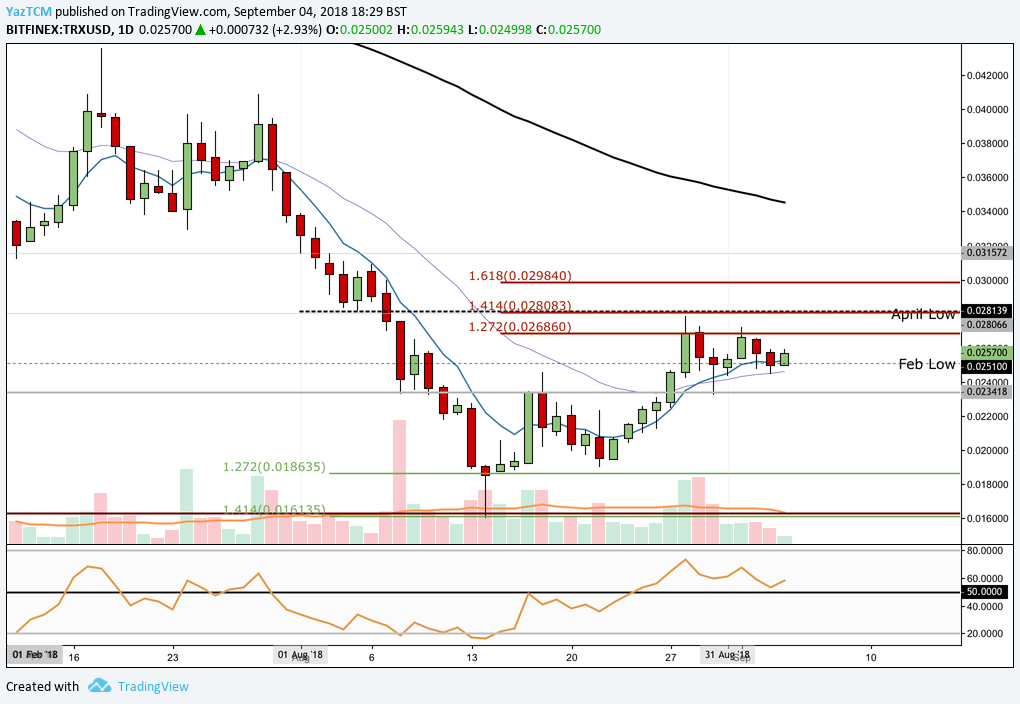
Analysing the market from the short term perspective above, we can see that during the run up toward the TVM launch for Tron, the market began to rally. It eventually managed to break above the upper boundary of the range we had highlighted priced at $0.023.
We can see that that market continued to rise until finding resistance at the short term 1.414 Fibonacci Extension level priced at $0.028 before rolling over slightly.
We can see that the market has manage to remain within the boundaries between April’s low and February’s low. If the bulls can continue with their recent momentum and push price action back above the 1.414 Fibonacci Extension level priced at $0.028 we expect immediate resistance to be located at the 1.618 Fibonacci Extension level priced at $0.029.
If the bullish momentum can continue even higher we expect further resistance to be located at the 100 day moving average which is currently hovering around the $0.034 handle.
Alternatively, any bearish pressure is expected to be supported at the $0.023 handle. This price level provides significant resistance previously (previous resistance is now new support). Further long term support expected below this level is then expected at the downside 1.272 Fibonacci Extension level priced at $0.018.
The technical indicators within the market are beginning to show favour toward the bulls as the RSI breaks above the 50 handle. If the RSI can make higher highs above 50 we can expect the bullish momentum to continue within the market.
Let us continue to analyse price action at a closer time frame.
TRX/USD – SHORT TERM – 4HR CHART
https://www.tradingview.com/x/hZCjmmvL/
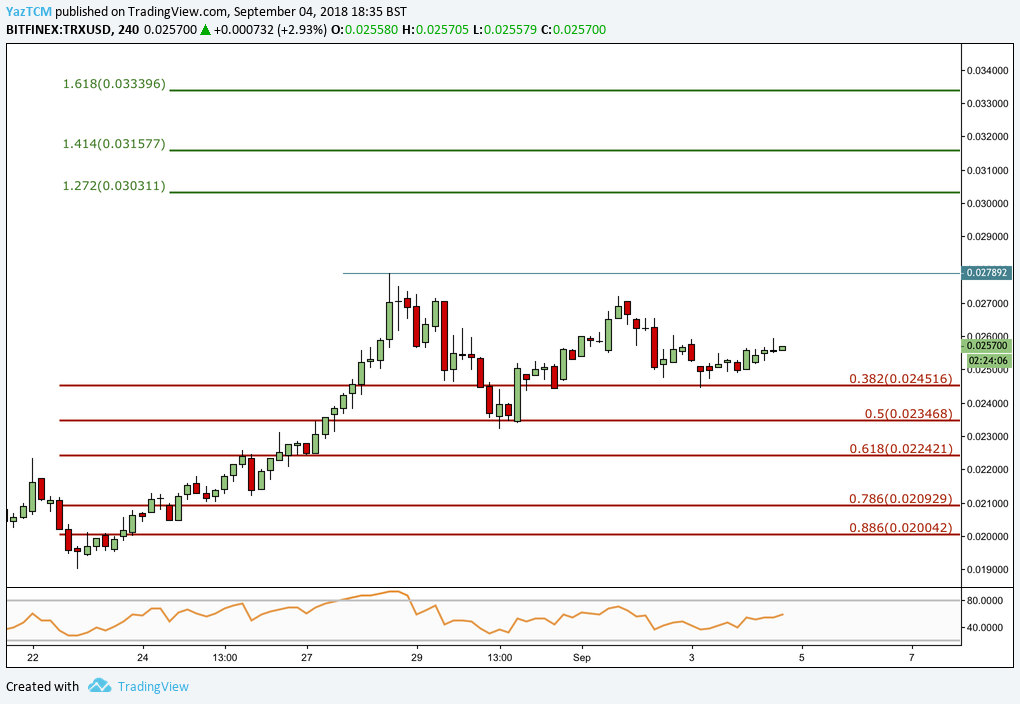
Analysing price action from the benefit of a shorter time frame, we can see that the recent bullish run saw price starting from a low of $0.019 on the 22nd of August 2018 to a high of $0.0278 on the 28th of August 2018. This was a price increase totalling 45% from low to high.
We can see that after placing the high, price action has rolled over and found support at the .5 Fibonacci Retracement level priced at $0.023. This Fibonacci Retracement has been measured from the low to high outlined above.
We can see that price action has since rebounded and continues to remain to trade sideways.
From a short term perspective, if the bulls can push price action above the previous high at $0.027 we expect immediate resistance to be located at the 1.272 Fibonacci Extension level priced at $0.030 followed by the 1.414 Fibonacci Extension level priced at $0.031.
, and Stellar (XLM) Price Analysis – Recovery Expected Above Major Support Levels")
 and Stellar (XLM) Weekly Price Performance Overview")
