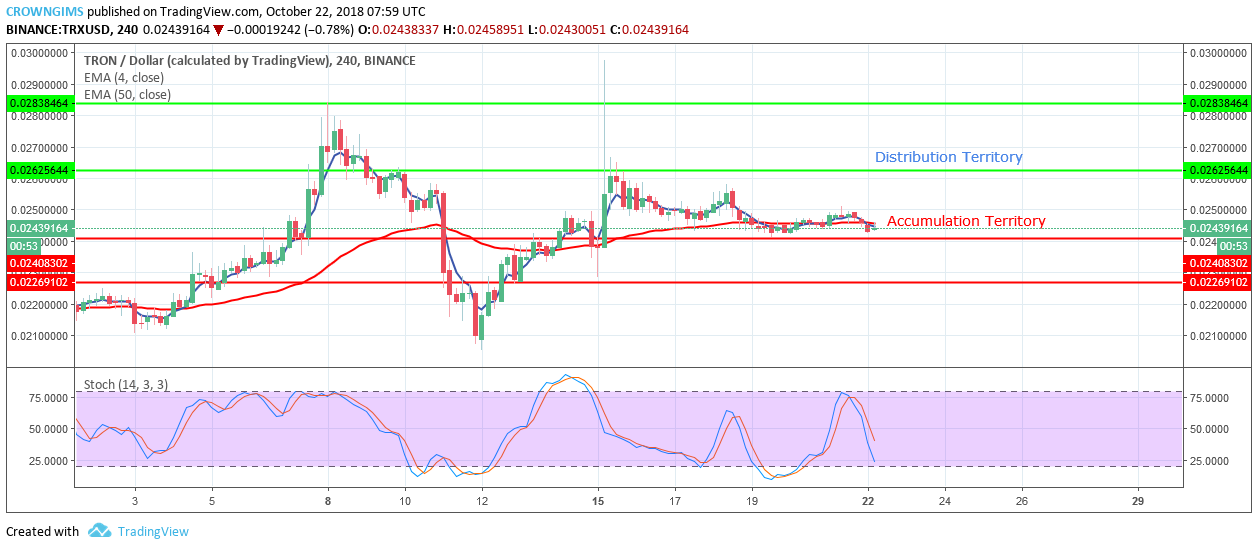
Distribution Territories: $0.026, $0.028, $0.030
Accumulation Territories: $0.024, $0.022, $0.020
TRX/USD Medium-term Trend: Ranging

TRX/USD experienced pull back on October 15 after sudden increased that pushed the price to the distribution territories of $0.030. The bears pushed back the TRX price below the distribution territory of $0.026 and started consolidating within the bound range of $0.026 and $0.024. TRX is ranging in its medium-term outlook.
The bulls have no enough momentum to increase TRX price beyond the distribution territory of $0.026. Likewise, the bears have not gotten enough pressure to push TRX price below the accumulation territory of $0.024.
More buyers with an increase in pressure are needed in the market to increase the TRX price to the distribution territory of $0.026, break the territory and expose it to the distribution territory of $0.028. Should the bears increase their momentum and break the accumulation territory of $0.024 the coin will find its low at the accumulation territory of $0.022.
TRX is below the 10-day EMA and 50-day EMA with the stochastic oscillator 14 above 20 levels and its signal lines point down, thus signaling a downward.
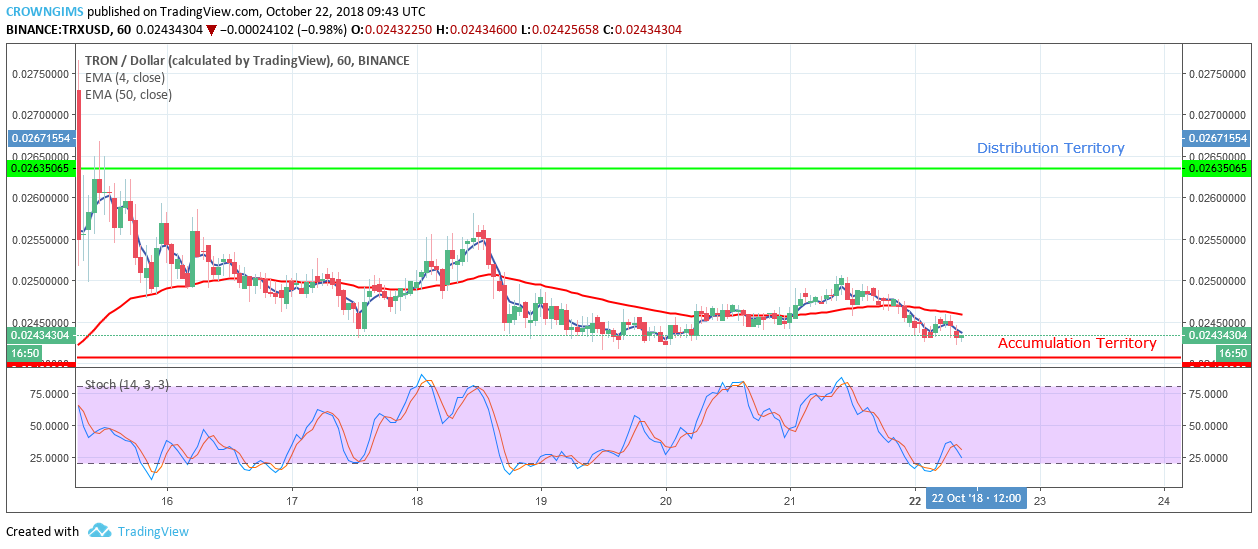
TRX/USD Short-term Trend: Bearish

Today, the price has been in the bearish movement toward the demand zone of $0.024 on the short-term; more bearish candles are forming indicating TRX price is falling gradually. Bears were gradually taking control of the market.
As at present, the price is below the dynamic support of 10-day EMA and the 50-day EMA but the two EMAs are not well separated indicating consolidation is ongoing. In case the bears increase their pressure and break the demand zone of $0.024 downside, the price will be exposed to the lower demand zone of $0.023. The Stochastic Oscillator is above 20 levels with its signal lines point to the south which indicates a sell signal.


