
 Bulls")
Multiple players called $100k for Bitcoin as the closing price for this year. On-chain indicator and S2F model points to $100k but not much is being said about the technical charts at this time. Although fundamental analysis carries a lot of weight for investors and traders alike, technical indicators are also worth noting. As far as the short-term future of Bitcoin is concerned, the technical charts are pointing at a fruitful journey for Bitcoin within the last months of the year.
Having closed September, the last month of the third quarter with a top candle that indicated that there was a volatility range, analysts take it that September “had consolidation-type of movements mainly where intra-month price oscillated between the extreme high and low of the range.”
Going forward, popular trader and investor CryptoBrib is weighing in on the possible outcome of the 4th quarter, starting with what seasonality holds for Bitcoin in this quarter.
As seen in his recent market report, the investor made some remarkably bullish statements, one of which reads; “Seasonality and Q4 suggest that historically Q4 was always (except for 2014, 2018 bear markets) of extreme upwards volatility returning double-triple digit % returns on average.” I expect no different this time. Seasonality is on the bullish side.”
Additionally, the Birbicator, a custom indicator prototype based on a Stochastic oscillator has just now confirmed a bullish crossover for Bitcoin’s momentum. In the coming months, the bulls are expected to show up and show out.

“Momentum & trend-wise, Birbicator has confirmed bullish crossover for momentum proving that the long-term market upside continuation is to occur. The direction is stronger to the upwards again. Monstrous signal giving the overall narrative for the next few months.”
Keep in mind that the MTF chart has covered up the bears and the traders who shorted Bitcoin at $40,000 in extreme fear. Local consolidation is now expected to be between $56,000 and $58,000. A bullish breakout into the supply zone around the $50k-$53k gray area in the image below.
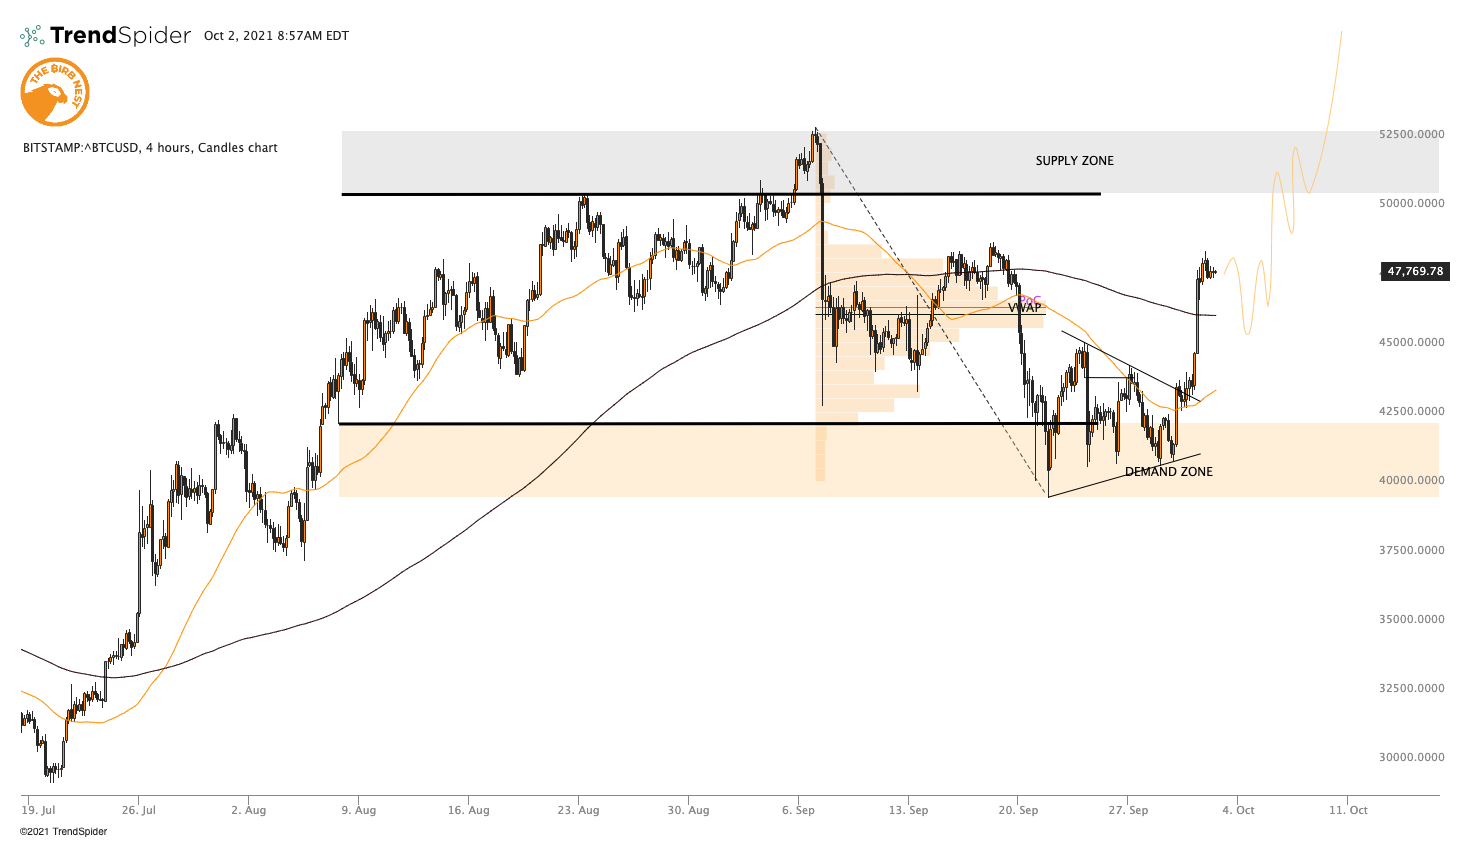
Lastly, the bulls are expected to take over the gray area and reclaim it as a demand zone, thereby favoring the $58k-$60k region retest within the next impulse.
In the long term, Bitcoin bulls will be positioned for another attempt to break through the $65,000 all-time high reached back in April, that is after the $56,000- $58,000 breakout has been recorded.
When it comes to market sentiments, the market is currently neutral. But the analyst insists they are wrong, adding that they were wrong when Bitcoin was at its $40,000 lows. “The more extreme the emotions, the wrong-er the crowd is.” he added.


