
![Technical analysis: Bitcoin [BTC] predictions based on Ichimoku, DMI, and Keltner Channels](https://zycrypto.com/wp-content/uploads/2018/07/Technical-analysis_-Bitcoin-BTC-predictions-based-on-Ichimoku-DMI-and-Keltner-Channels.png "Technical analysis: Bitcoin [BTC] predictions based on Ichimoku, DMI, and Keltner Channels")
An Ichimoku analysis of the Bitcoin price may suggest that a transitory bull run may be imminent for the month of July. This analysis combines technical analysis of a Directional Movement Indicator (DMI) and a Keltner Channel on the 1-Year charts.
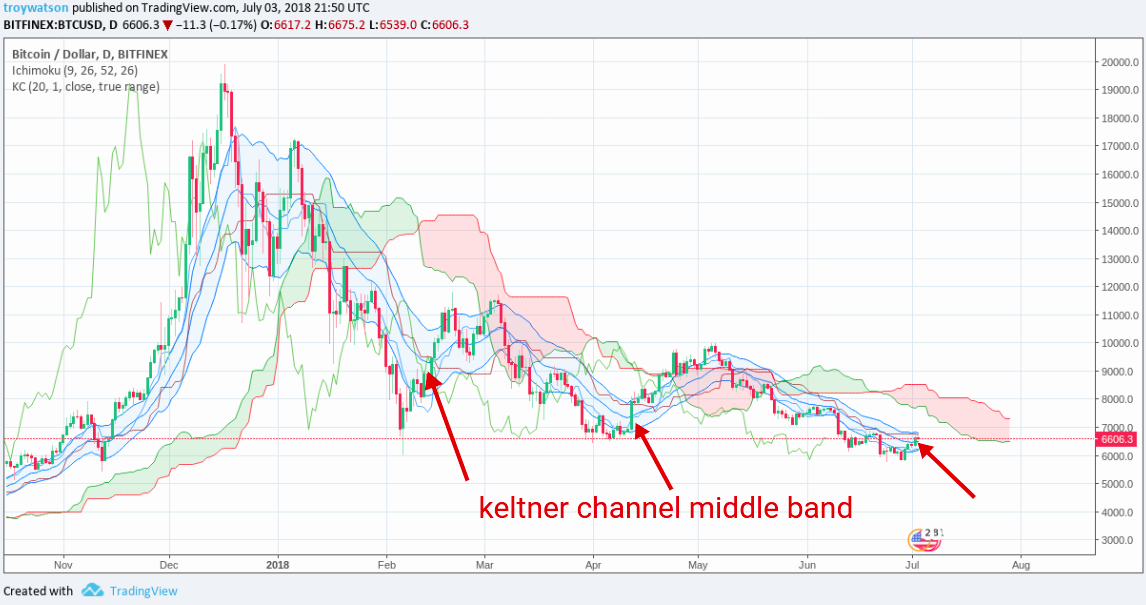
The Bitcoin price has crossed the midline of the Keltner Channel on the 1-Year chart. This may suggest a short term gain in price that could even transition to a bull run. Classical Dow theory includes transition periods of the market that pivot between bull and bear runs. The current charts show a clear pattern with the Keltner Channels where a breach of the midline precedes a mini-bull run.
Collaborating this pattern, we can see a pattern with the Directional Movement Indicator (DMI) preceding the mini-bull runs of the months annotated in 2018. The patterns seem most pronounced when we switch back to the 1-Year chart before zooming into the price index. Such a method of looking at the forest beyond the trees allows us to detect movements that could thwart short term gains at the hour charts.
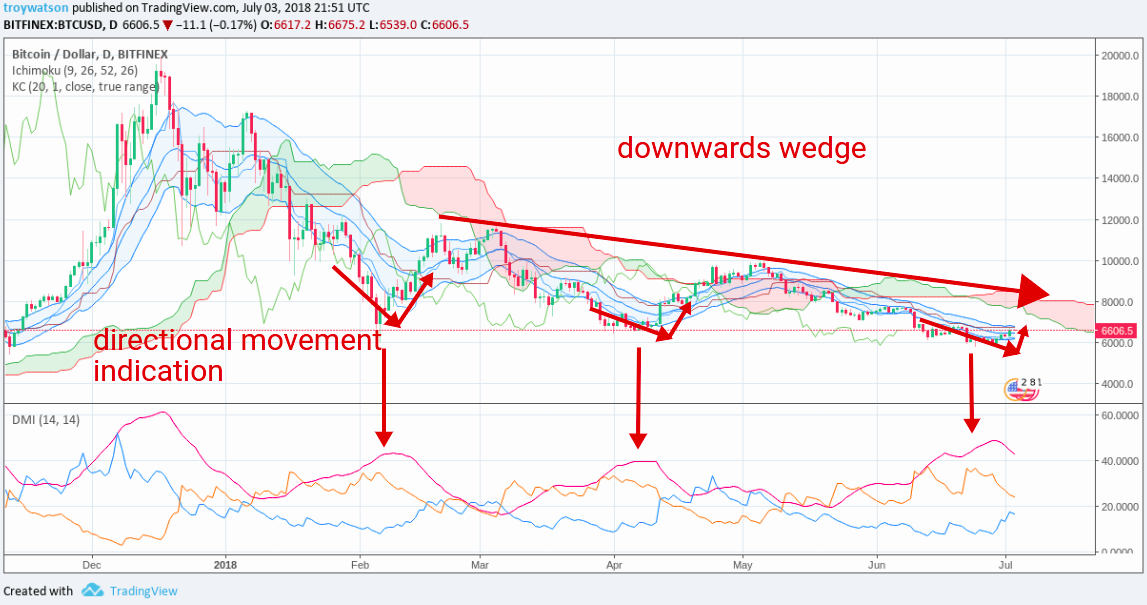
The year of 2018 has seen a downwards wedge, lower volatility, and lower trading volume over a long period of time The Keltner pattern may occur but with a less pronounced price rise because of such factors. Alternatively, these factors may form resistance above the current price and disallow the mini-bull from happening.
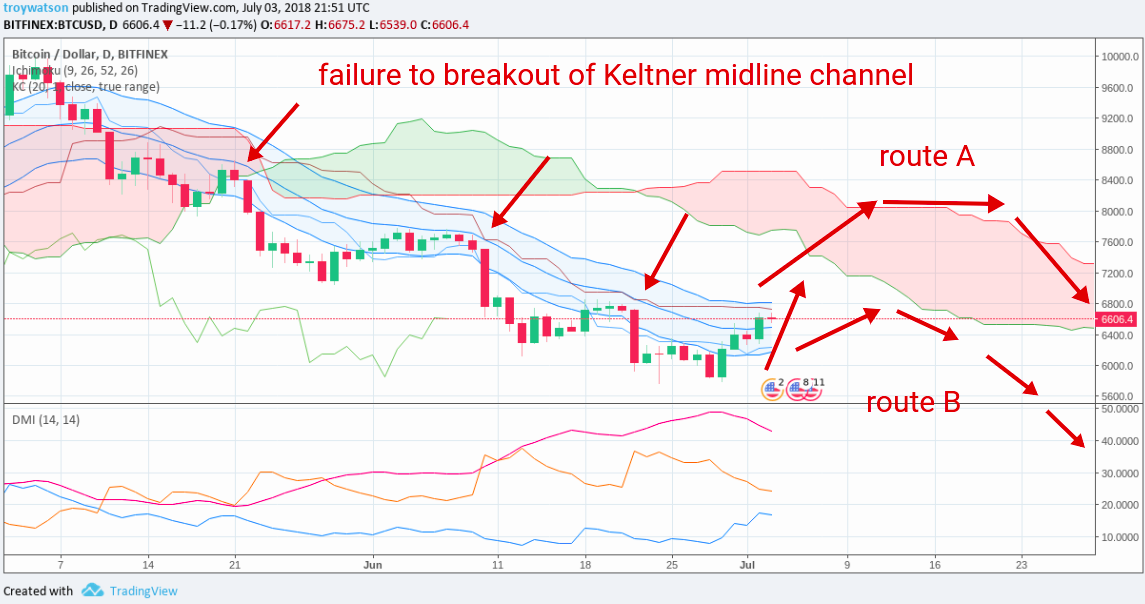
The Ichimoku cloud could assist us in detecting whether the Keltner signal plays out with its mini-bull signal or whether the resistance caused by the downward wedge lowers our price. The Ichimoku refers to the idea of viewing the forest above the trees by including a finely tuned mix of rolling averages that can allow us to see the context of the current price.
The price may pierce the red Ichimoku cloud and this would signal a mini-bull. Conversely, if the price continues to descend below the red Ichimoku cloud then the mini-bull run will most likely not happen. We would be looking out for steep gains as to avoid a descending drop below the cloud.
The historical price has seen various failed breakouts that were unable to pierce the midline of the Keltner channel. Our pattern so far has achieved a midline piercing but we can combine this pattern with the Ichimoku to see if it continues this trend.
The price has neither continued above or below the Ichimoku cloud and this may indicate a transition price with the market. In a typical bull market we may see the price consistently hold above the green cloud and with a bear market the price below the red cloud. This is not what we’re currently seeing and instead we’re seeing an oscillating signal between the clouds.


