
![Technical Analysis: Bitcoin [BTC] 10-day forecast for rounded top formation](https://zycrypto.com/wp-content/uploads/2018/05/Technical-Analysis_-Bitcoin-BTC-10-day-forecast-for-rounded-top-formation.png "Technical Analysis: Bitcoin [BTC] 10-day forecast for rounded top formation")
The forecast for the next 10-days is one of a rounded top formation which may eventually breakout and reverse towards the $10,000 mark.
Bitcoin price has continued a rounded top formation since the month of April and this has de-accelerated the trend lines. The formation comes after we saw a rounded bottom that reversed the BTC price trend from a downward slope to an upward formation.
The price change has nearly been like a car switching from top gear to reverse in a matter of minutes. The rounded top therefore appears to be a reversal of such a change in momentum and may indicate a short term downward trend.
The charts show a scallop pattern that often precedes a large percent change on the market and we may see more of these patterns as the BTC price breaks above the $10,000 mark. These patterns may form before a large percent change is experienced in the near future.
We created a 10-day forecast using a simple regression model and the historical prices of Bitcoin. We also computed a predicted Root Mean Square Error (RMSE) coefficient for the given forecast. The predicted RMSE is 0.0417 which translates to around 4.2% error in the forecast predictions made.
It is worth noting that this is a rough estimate but is still useful nevertheless in getting a view of the possible price changes over the coming week.
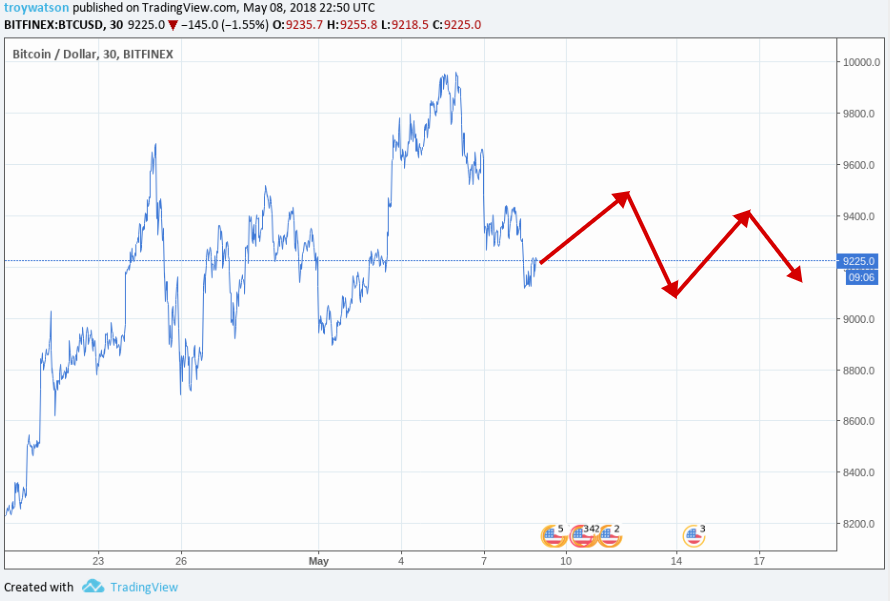
Bitcoin price hit a low at around the $9,000 mark which may require a rallying or pull back in response to the quick drop. The rally, however, may be short term peak and we may see a downward trend in a matter of days before a new rally responds to this trend.
The 10-day forecast shows a downward triangular pattern that could be a downwards wedge formation. One may expect such an organic structure like this as opposed to a rectangular pattern which may indicate wash trades or pooling activity.
The 10-day formation may continue with the rounded top trend and then break-out into a reversal above the $10,000 mark. Alternatively, the price may form a rounded bottom and slowly progress towards the $10,000 mark at a much more gradual pace.
| BTC 10-day Forecast using Regression Model | ||
| Date (UTC time) | Predicted Price (Close price) | |
| Tue, 8 May 18 | $9,350.02 | |
| Wed, 9 May 18 | $9,468.92 | |
| Thur, 10 May 18 | $9,450.89 | |
| Fri, 11 May 18 | $9,359.09 | |
| Sat, 12 May 18 | $9,244.00 | |
| Sun, 13 May 18 | $9,364.09 | |
| Mon, 14 May 18 | $9,382.44 | |
| Tue, 15 May 18 | $9,370.96 | |
| Wed, 16 May 18 | $9,430.31 | |
| Thur, 17 May 18 | $9,380.32 | |


