XLM/USD Price Long-term Trend: Bearish

Resistance levels: $0.12, $0.14, $0.16
Support level: $0.09, $0.08, $0.07
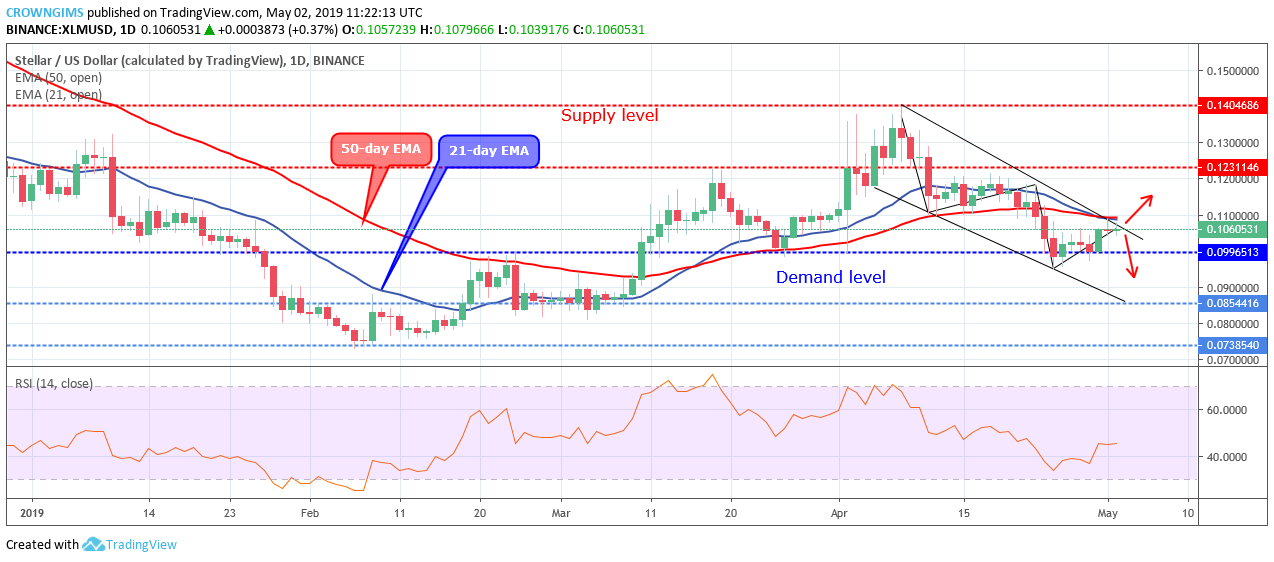
The XLM price is bearish on the long-term outlook. XLM has been bullish for many days and topped at $0.14 on April 07. The Bulls’ momentum was lost and could not break up the $0.14 level.
Bears gained pressure and this is noticed with the formation of a hanging man candle pattern; it is a bearish reversal candle which pushed down the Stellar price. The former demand level of $0.12 was penetrated downward and the bearish momentum extended the price down to $0.09 level on April 25.
This price action movement on the daily chart has resulted in the formation of a Flag pattern. The coin bounced again at the $0.09 level (lower trend line) to touch the upper trend line.
The two EMAs are interlocked to each other and the XLM price is currently trading below the 21 periods EMA and 50 periods EMA. The Relative Strength Index period 14 is at 45 levels with the signal line horizontally flat without showing any direction indicates that consolidation is ongoing in the Stellar market.
The bullish breakout of the XLM price at the upper trend line of the flag will push the price to reach $0.12 resistance level. Should the bears prevail and the price bounce at that level, there would be a break down at $0.09 that may place the price at the low of $0.08 level.
XLM/USD Price Medium-term Trend: Bearish

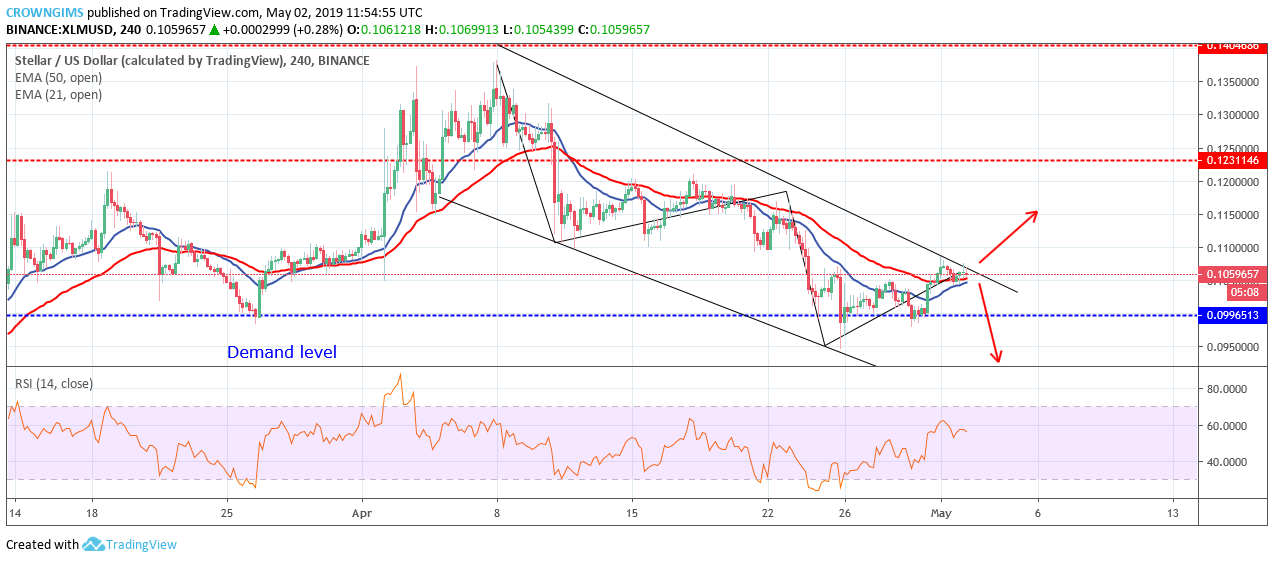
On the medium-term trend, the XLM price is bearish. The bearish momentum on the 4-hour chart as high as the price dropped from the high of $0.14 to the low of $0.09 level after the downward penetration of the barrier at $0.12 level. The bearish momentum has led to the formation of a bearish flag pattern on the 4-hour chart.
XLM is trading on and around the 21 periods EMA and 50 periods EMA. The Relative Strength Index period 14 is at 60 levels and the signal line point down which implies sell signal.


