
 Price Analysis: Currency Could Be Breaking Out Anytime Soon")
Stellar (XLM-USD)
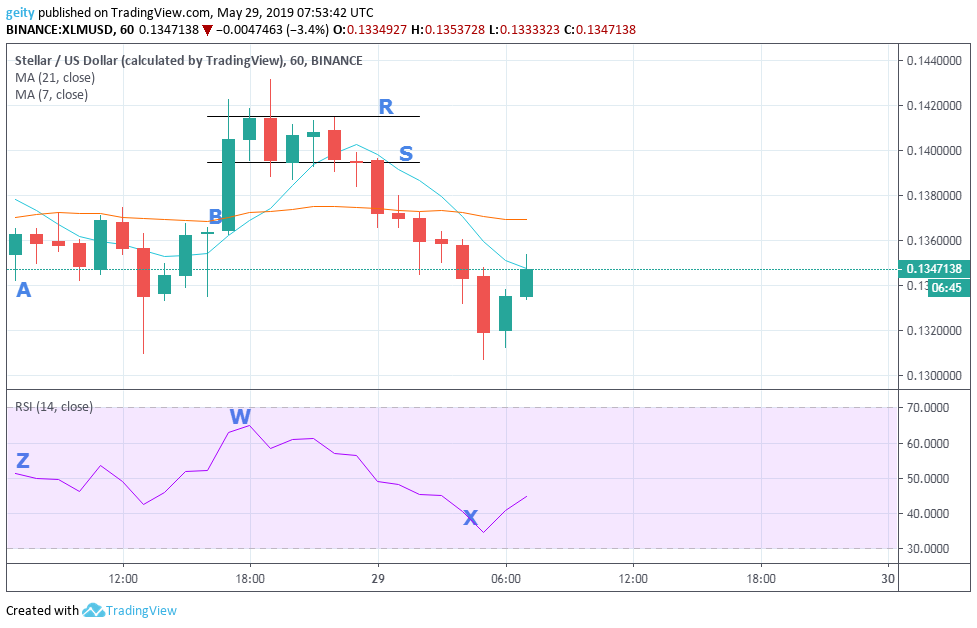
On an hourly chart, one of the top ten digital assets is seen trading on a ranging market that has been buttressed by the moving averages which are intertwining.
XLM/USD pair began trading at $0.1362567 (A) against the current price of $0.01359656. This was later followed by a sideways price momentum that later was dropped to a low of $0.1309124. Due to the presence of a three inside up candles, a breakout occurs that pushed the price rally past (B) where the lower price was rejected that led to a much higher price of $0.142273.
The RSI is steeply ascending from Z to W thus indicating the presence of buying pressure. Resistance level, therefore, stood at $0.1415235 and support level at $0.1394731. These significance levels were tasted severally. Later on, a break down was observed at around 29th May 0000h, that further pushed the price momentum down to close at 0.1319157.
The RSI is later seen declining from W to Z reflecting strong selling pressure at that period of time.

FORECAST
The RSI indicator is seen heading north during the last 2 hours, this indicates that there is a high possibility of a bullish price rally in the next few hours. The bulls next target will most likely be to break above $0.139 and maintain the $0.14 price level.
IOTA (MIOTA-USD)
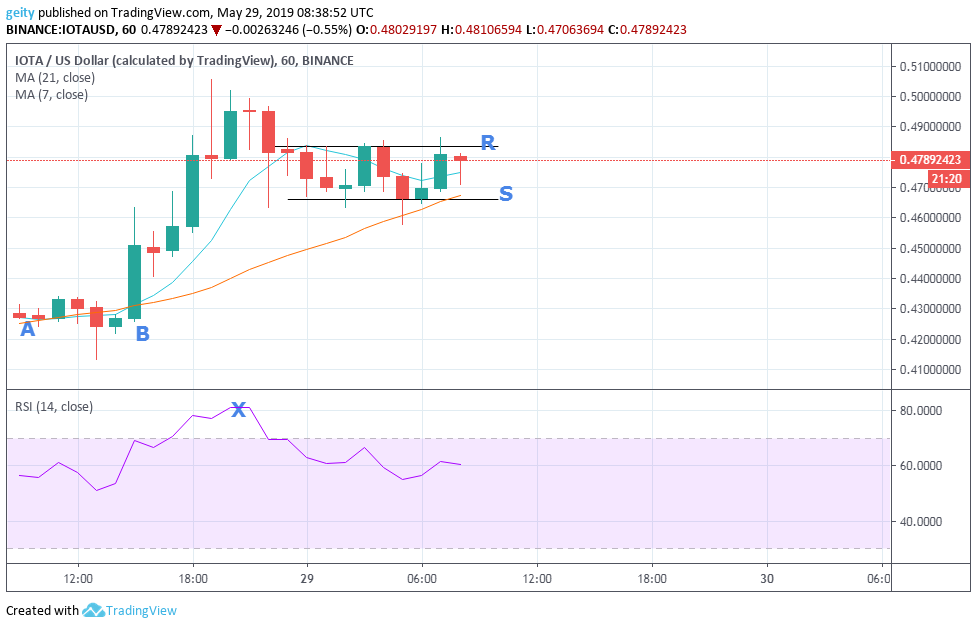
A short-term bullish market move has been proved by the presence of the ascending triangle that is seen in the last 24hrs.
The RSI is generally seen above level 50 thus indicating a strong buying pressure, with the 7-day MA being above the 21-day MA indicating a bullish signal.
IOTA, therefore, began trading at $0.42725232 (A). This was later followed by a short period of consolidation that reflected luck of momentum in the market from A to B.
At around May 28TH as at 15:00, a breakout is observed with repeated emergence of a bullish regular divergence pattern, which reflected the strength of buyers where the price performance was pushed up to a high of $0.50179654.
The RSI X is therefore seen above 70 thus indicating that the market was overbought at that period of time. Later on, around May 28th 21:00, a Doji candle is seen that showed rejection of higher price by traders, this resulted to a downtrend where price rally was dipped to a low of $0.46315107.
Resistance level, later on, stood at $0.48348033 and support level stood at $0.46601753.
An upward price rally was later seen that placed the digital asset to its current price of $0.519, this may be due to IOTA being confirmed as a new host to the music store on its blockchain and its new upgrade that makes IOTA highly decentralized.
FORECAST
A sideways price movement is likely to be seen since the RSI indicator is trading flat during the last 1 hour.
The 7-day MA is seen to have bent upward and is still above the 21-day MA indicating a strong bullish signal. New target should be placed at $0.53.


