

XLM/USD Medium-term Trend: Bearish
Supply levels: $0.22, $0.23, $0.24
Demand level: $0.20, $0.19, $0.18
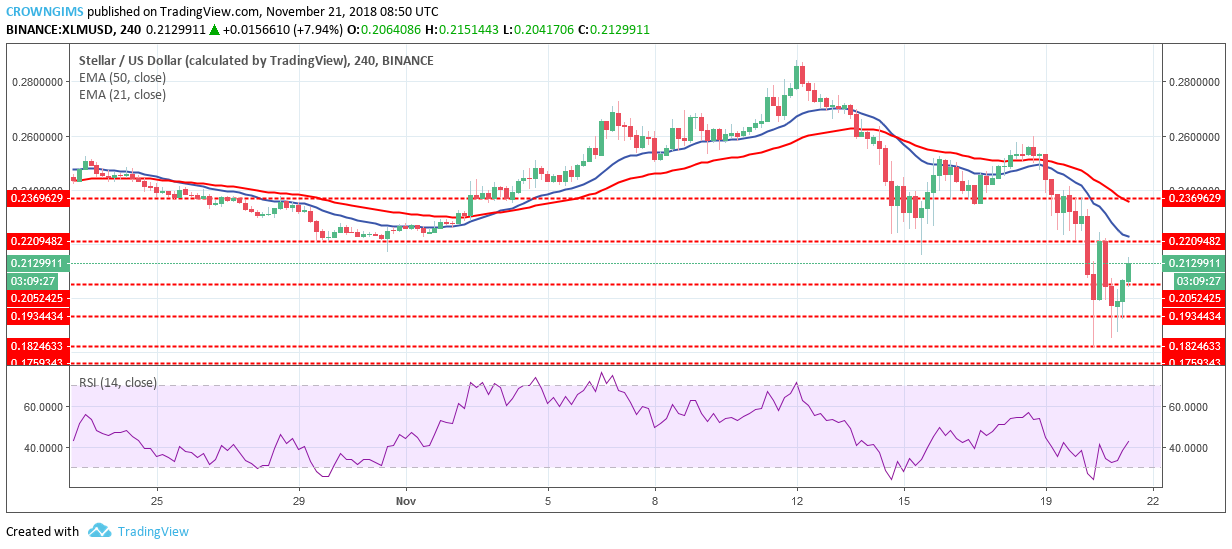
XLM continued its bearish movement on the 4-Hour chart. XLM reached its low of $0.18 price level on November 20, further price decrease was ejected by the bears. XLM price was pushed to the supply level of $0.22 where the bull lost the pressure and the bears returned the price to its previous low price level of $0.18. The bulls were making attempt to take over the XLM market by the formation of bullish pin bar at the demand level of $0.20.
XLM is still trading below 21-day EMA and the 50-day EMA, which confirm the bears’ pressure and the bearish movement is ongoing. Nevertheless, the RSI is above 40 levels and its signal line pointing upward indicate buy signal.

XLM/USD Price short-term Trend: Bullish
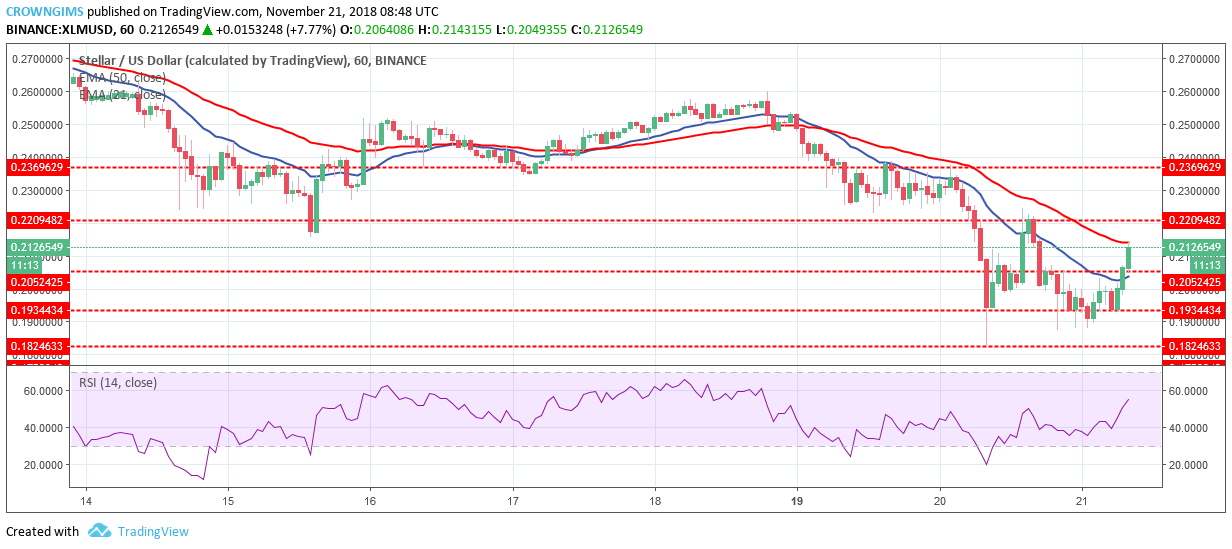
XLM is bullish on the 1-Hour chart. The bulls are coming up into the XLM market with high momentum gradually. This is signaled on the 1-hour chart as the bullish engulfing candle formed on the demand level of $0.19. The next candle is bullish already crossed upside the dynamic resistant of 21-day EMA and also broken the supply level of $0.20. The price is now exposed to the supply level of $0.22.
The XLM price is currently between 21-day EMA and the 50-day EMA with strong bullish candles which connotes buy signal. Moreover, the RSI with its signal line is above 50 level and the signal lines pointing to the north, which indicates the bulls’ momentum is gradually taking over the market. There is a probability for the trend to change from downtrend to uptrend.
 Price Up 62% From Bottom, Can The Bulls See More Gains?")

