XLM/USD Price Medium-term Trend: Bearish

Resistance levels: $0.10, $0.12, $0.13
Support level: $0.09, $0.07, $0.05,
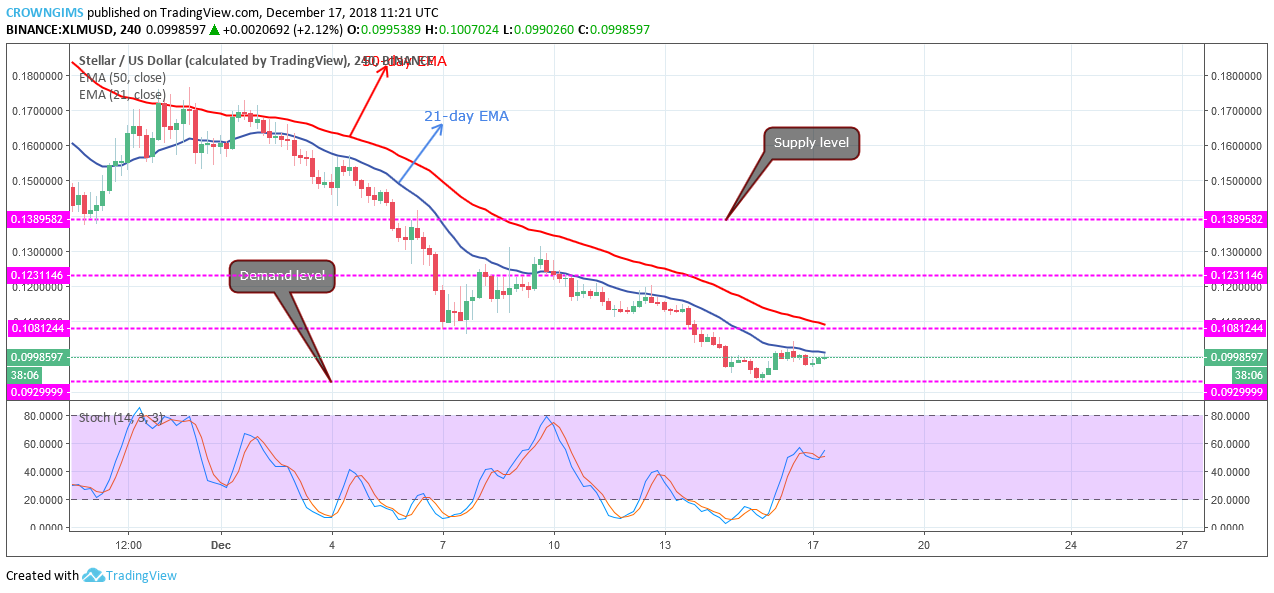
The XLM price is bearish on the medium term. The coin bottomed at the support level of $0.10 on December 7. The bulls resisted further downward movement, XLM price was pushed up, broke above the resistance level of $0.12 (the push-up served as a price retracement for the downward trend on the XLM market). XLM resumed its bearish trend after the retracement and the price fell from $0.12 price level to the low of $0.09 price level. Currently, another price retracement is ongoing before the downtrend continues.
XLM price is trading below the 21-day EMA and 50-day EMA with the two EMAs fanned apart implies that bearish pressure is high on the XLM market. The Stochastic Oscillator period 14 is above 50 levels with signal lines pointing up indicates buy signal, which may be a pullback. A breakout below the support level of $0.09 will further decline the XLM price towards $0.07 – $0.05 price level.
XLM/USD Price short-term Trend: Ranging

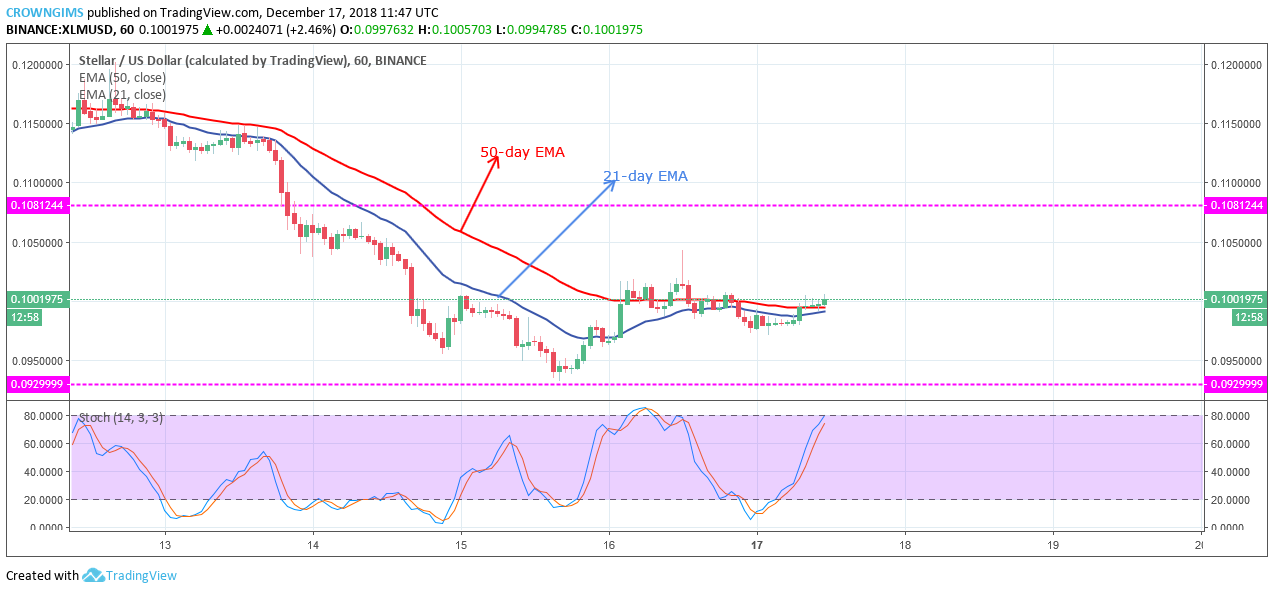
On the short term trend, the XLM price is ranging. The bears lost their pressure at the support level of $0.09 price level. The morning star candle pattern formed at the level signaled the returning of bullish pressure into the XLM market, which pushed the price up but resisted by the dynamic resistance and support that led to the price consolidation on and around the 21-day EMA and 50-day EMA.
The price is consolidating over the two EMAs and the two EMAs closed to each other confirm the ongoing consolidation movement. However, the Stochastic Oscillator period 14 is above 70 levels with signal lines pointing to the north which indicates buy signal. Should there be a clear penetration above the resistance level of $0.10 then the bullish rally will be anticipated towards the resistance level of $0.12 – $0.13.


