
 Technical Analysis #002 - Ripple Finds Support At Short Term .618 Fibonacci Level")
Ripple, the cryptocurrency founded by Ripple Labs, has experienced a strong start to the month of June. XRP, at the time of writing, is up 3.55% over the past 7-days and is up a total of 30% from the low placed in late May.
The cryptocurrency is currently trading at $0.6619 and is sitting at 3rd place in terms of overall market cap with a value of $26 billion.
Price action, from a long term perspective, has recently been trading within a range-bound condition but has recently shown some bullish signs to the start of the month.
Ripple was designed to allow for faster banking and can boast over 100 partners that are banks or financial institutions. Along with these partners, XRP has also gained support from the mobile app Revolut, aiding in its quest for a further mainstream appeal.
To add to the speculation, Coinbase has recently moved to Japan with the motion to increase operations. Rumours have started to grow that Coinbase could be adding Ripple as it is the highest traded currency in Japan.
All of these fundamental factors favour the bulls within the market as Ripples future potential grows as time moves on. Let us take a look at the technical side of the market below.
Price Analysis
LONG TERM OVERVIEW
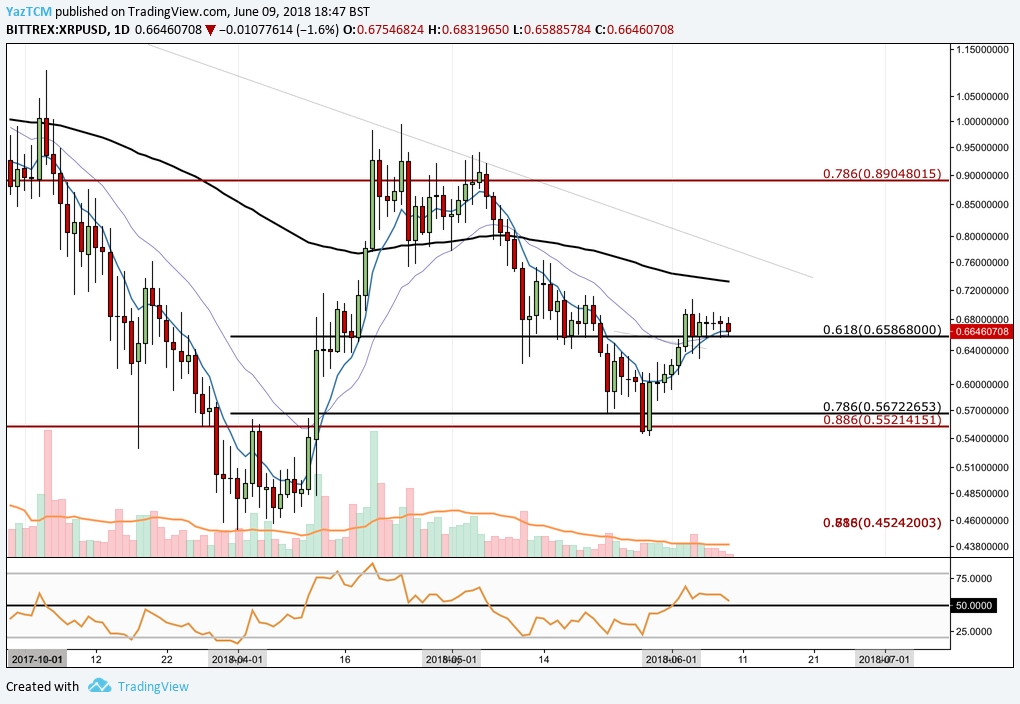
XRP/USD – LONG TERM – DAILY
Not much has changed from a long term perspective within the market since our last article. Price action is still stuck within the range bound by the .786 Fibonacci Retracement and the .886 Fibonacci Retracement, at a price of $0.89 and $0.55 respectively.
For a quick reminder, here is a link to the article.
XRP/USD – SHORT TERM – DAILY
https://www.tradingview.com/x/dOF5otyG/
Looking at the chart above, we can see that XRP had experienced an impressive bullish run in the month of April as price rose from a low of $0.45 to $0.84. Since then the currency has retraced all the way to the long term .886 Fibonacci Retracement, mentioned above, at price $0.55. We can also see that this long term Fibonacci Retracement is confluenced with another short term Fibonacci Retracement taken from the bullish run in April, specifically, the .786 Fib Retracement at $0.56.
Price action has since rebounded and has found support at the the short term .618 Fibonacci Retracement at $0.65 over the past few trading sessions.
If the market can garner some bullish momentum then we may see price appreciate until near term resistance is seen at $0.90.
Alternatively, if the market fails to hold the .618 Fibonacci level then we may see prices fall before finding support and retesting the $0.55 handle.
The technical indicators are providing promise that favours the bulls. The RSI indicator has been consistently over 50 since the start of the month. If the indicator can remain above this level we may see prices make another bullish run.
To add to this promise, the 7-day EMA and the 21-day EMA have crossed each other, recently, over the past few trading sessions. If these two moving averages can pull away from another and head toward the 100-day SMA this would indicate strong bullish momentum within the market.
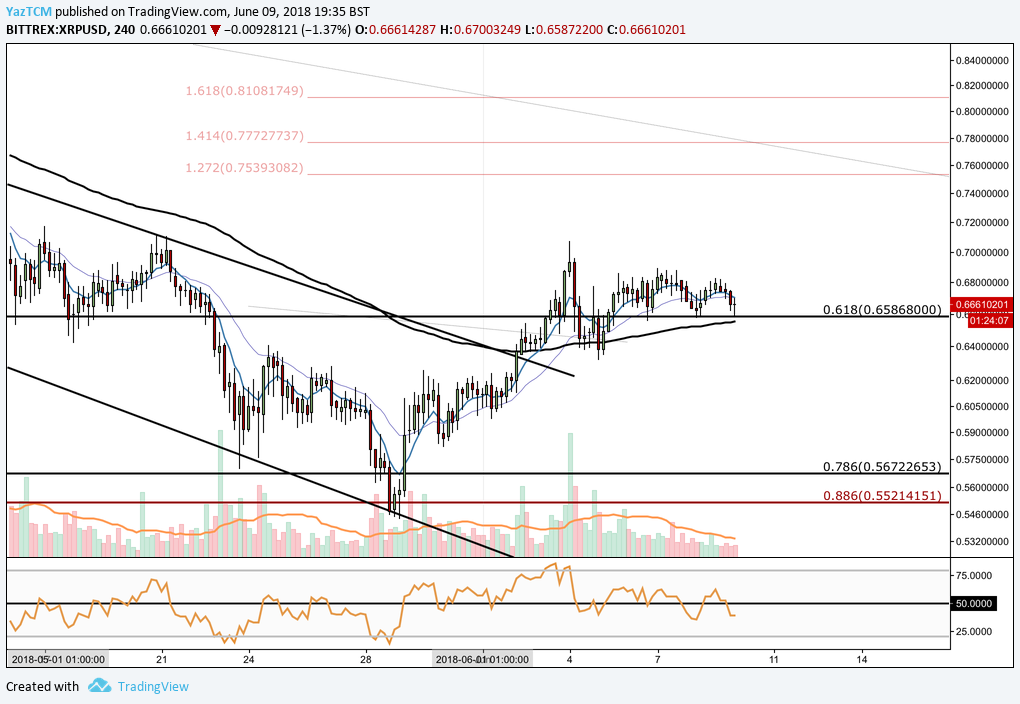
XRP/USD – SHORT TERM – 4-HOUR
https://www.tradingview.com/x/KIk5XP1o/
Taking a deeper dive into price action, we can see that price has recently broken above the descending channel highlighted in our previous article. After price action had broken above the channel, it went on to test near term resistance at $0.70 before failing to hold against it.
Since then price has traded sideways finding support on the short term .618 Fibonacci Retracement located at $0.65. If price can hold above the .618 Fibonacci Retracement and eventually close above the month’s high at $0.70, then we may see price action head toward near term extension levels located at $0.75, $0.77 and $0.81.
Alternatively, as mentioned above, price action could break through the .618 Fibonacci Retracement and head down toward long term support located at $0.55.
On a short term basis, the technical indicators are not giving too much support to either the bulls or the bears. The RSI has been battling above and below the 50 handle over the past few days and shows no sign on which way it intend to head next. To add further to this indecision, the moving averages are all trading sideways and are constantly becoming tighter as the market progresses indicating major indecision within the market.
Conclusion
On a technical basis, Ripple has been showing some promising signs over the past few weeks of trading. If price action can continue on this trajectory, XRP will be well on the way to making up some of the gains lost throughout the year.
To help aid this bullish trajectory, the adoption rate amongst exchanges, banks and financial institution is still increasing for Ripple. If the company continues to add more partnerships at this rate, mainstream adoption should not be far away.


