Supply zones: $0.31, $0.33, $0.34
Demand zones: $0.30, $0.28, $0.26
XRP/USD Medium-term Trend: Bearish

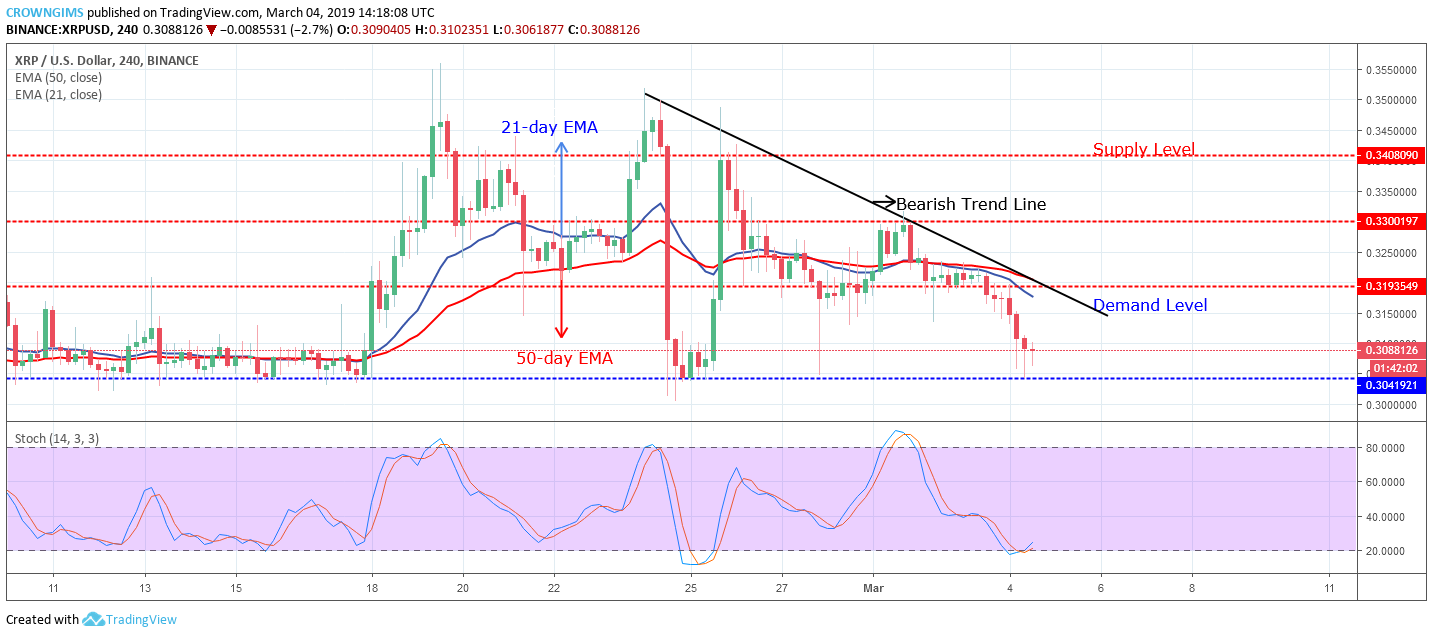
On the medium-term outlook, XRP/USD is on the bearish trend. As long as the drawn bearish trend has not been broken up, the bears still hold the market but immediately the bullish candle penetrates the trend line and closes above it, there is a likelihood for the trend to reverse.
The bullish momentum could not break up the supply level of $0.33 when the price reached the point on March 01. The bearish engulfing candle formed at the price level signal the arrival of the bears with full force. The bearish pressure returned the coin towards the previous low of $0.30 after breaking down the demand level of $0.31.
The two EMAs are well separated with 21-day EMA below the 50-day EMA bending downside with the coin below it, which indicates the strong strength of the bears. The stochastic Oscillator period 14 is at 20 levels (oversold region) with the signal bending up indicates that the bulls will soon take over the XRP market. In case the demand level of $0.30 does not hold, the bears will penetrate the level and may take $0.28 as its target.
XRP/USD Short-term Trend: Bearish

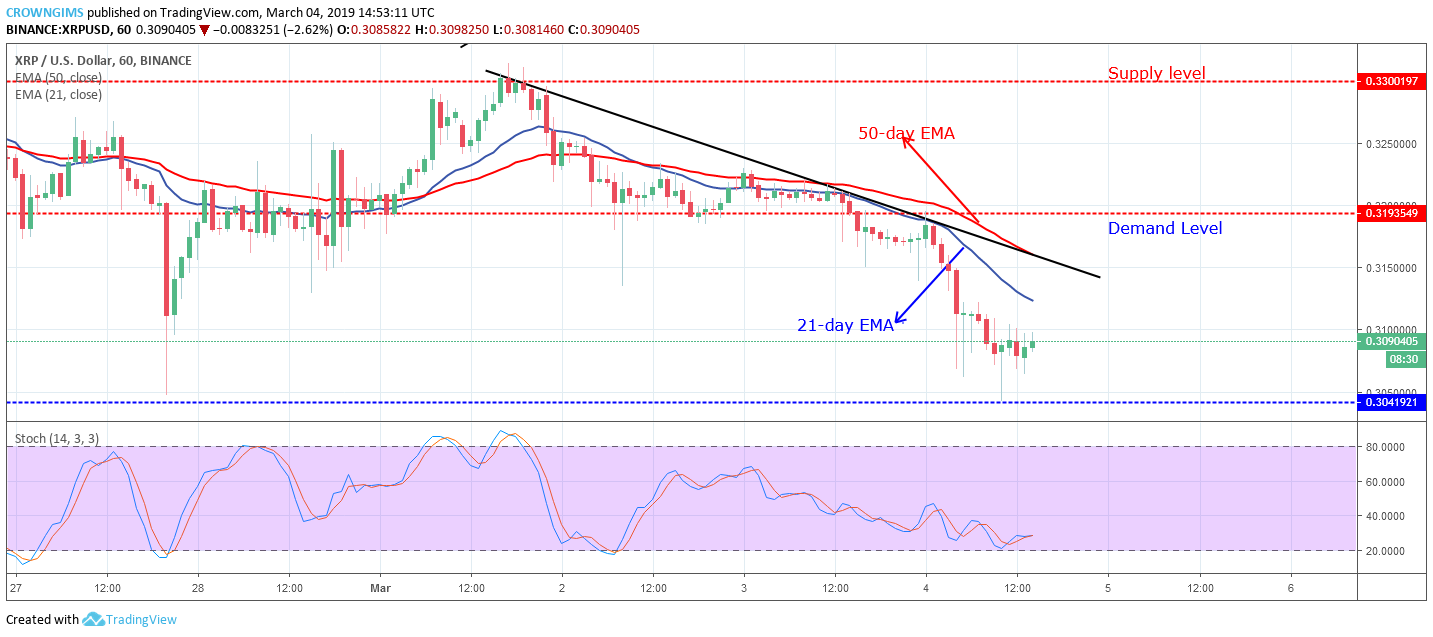
XRP/USD is on the bearish trend on the short-term outlook. The bears still hold to the XRP market in the short term. On March 2nd, the coin consolidated for a day (till March 3rd) before the XRP continues its bearish trend which broke down the $0.31 price level. Attempts made by the bulls to reverse the trend were rejected by the bears at the dynamic resistance level of 21-day EMA.
The Stochastic Oscillator period 14, is above 20 levels with the signal lines bending up indicates buy signal and gradually increase in bullish momentum which may be a pullback. Should the demand level of $0.30 holds the price may bounce and rally towards the $0.31 price level.


