

Litecoin has seen a small 1.18% price increase over the past 24 hours of trading. Litecoin is currently exchanging hands at a price of $54.57 after seeing a long sought after 7% price increase over the past 7 trading days.
Not much has changed for Litecoin in terms of market action. It continues to trade within the long term sharp descending wedge formation we have identified. At some point in the future we expect the wedge to be broken toward the upside or the downside.
Litecoin was intended to become a lighter version of Bitcoin with a shorter block time and faster transaction speeds.
The cryptocurrency currently holds the 7th position in terms of overall market cap rankings across the entire industry. It has a total market cap value of $3.19 billion after seeing a 36% price decline over the past 30 trading days. Litecoin is currently trading at a price levle that is 85% lower than it’s all time high price.
Let us continue to analyse price action for Litecoin over the short term to update our support and resistance levels
Price Action
LTC/USD – SHORT TERM – DAILY CHART
https://www.tradingview.com/x/CeOVCV3h/
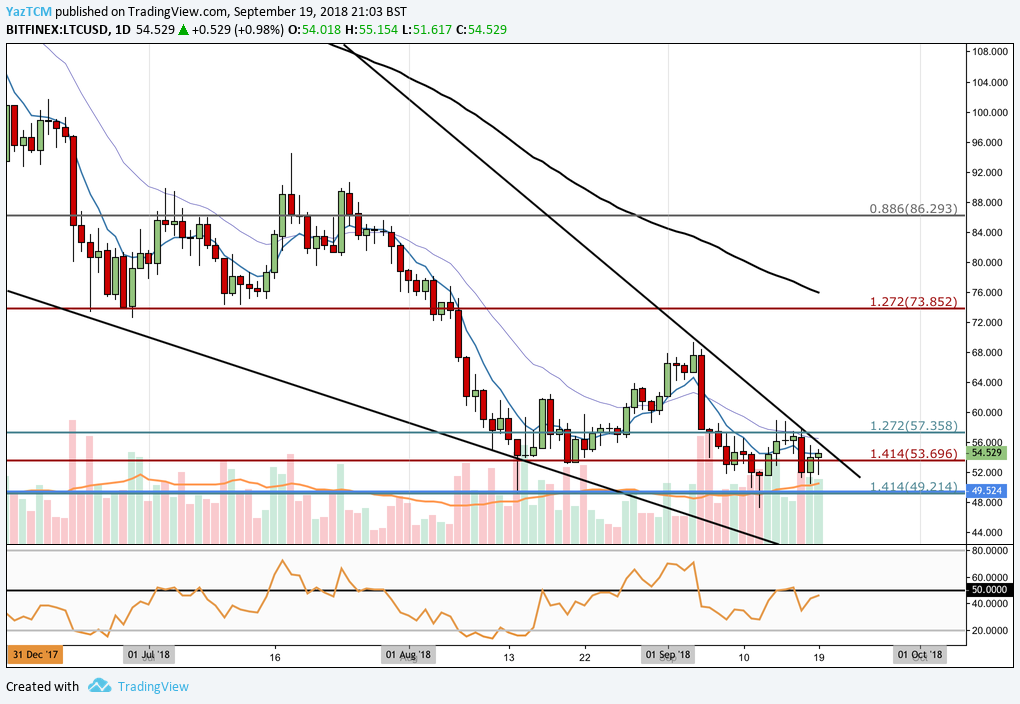
Analysing the market from the short term perspective above, we can see that the market has remained within the confines of the descending wedge formation. Each time price action tried to break up above the upper boundary of the trading wedge it was heavily rejected further adding to its validity.
In our last article we had also highlighted that if price action continued further lower we would expect support at the 1.414 FIbonacci Extension level priced at $53.69. We can see that price action has now approached this price level and is using this as support moving forward.
We can also see that, during September 2018, price action dipped lower to find support at a longer termed downside 1.414 Fibonacci Extension level (drawn in blue) priced $49.21. As the market approached this level we can see that it was heavily rejected as the market rebounded quickly.
Price action has been trapped within a trading range, for the majority of September 2018, bound between the 1.272 Fibonacci Extension level priced at $57.35 as the upper boundary of the range and the downside 1.414 Fibonacci Extension level priced at $49.21 as the lower boundary of the range.
Moving forward, if the bulls gather momentum at this support level we expect immediate resistance to be at the upper boundary of the trading range. Further resistance located higher if the bulls can push above is then located at the September monthly high around $80 followed by the downside 1.272 FIbonacci Extension level priced at $73.85. It is important to highlight that this price area contains the 100 day moving average which will add to the expected resistance in this area.
Alternatively, any negative pressure is expected to be absorbed by the lower boundary of the trading range priced at $49.21.
The technical indicators within the market are currently heavily leaning toward the bears at this moment in time. The RSI is trading under the 50 handle indicating that the bears are in control of the momentum within the market. If we are to expect to see any positive gains for EOS we would first need to see the RSI break back above the 50 handle to indicate that the bulls are in control of the momentum.

