
 Technical Analysis #002 - Litecoin pushed back above $85, $100 by months end _")
Litecoin has witnessed a small price drop toitalling 0.8% over the past 24 hours of trading. The cryptocurrency is currently exchanging hands at $86.84, at the time of writing and has experienced a 5.15% price hike over the past 30 trading days.
Litecoin was founded by ex-google employee, Charlie Lee, in October 2011. It was designed to be a lighter version of Bitcoin boasting block times ¼ the length of Bitcoins, faster transaction speeds, lower fees and superior tech in the form of SegWit and Atomic Swaps.
The founder of Litecoin has been under much scrutiny as he made the decision to sell all his LTC coins the day after LTC reached its all time high. After this, price action continued to depreciate significantly. Lee stated that he sold his coins due to a conflict of interest. He has recently made comments that he is doing everything in his power to push LTC back above its all time high to $400.
Litecoin is currently ranked at 7th position in terms of overall market cap across the entire industry. At the time of writing, Litecoin has a $5 billion market cap, $700 million away from 6th position held by Stellar.
Let us continue to analyse price action over the long term.
Price Analysis
LTC/USD – LONG TERM – DAILY CHART
https://www.tradingview.com/x/SQdapFzq/
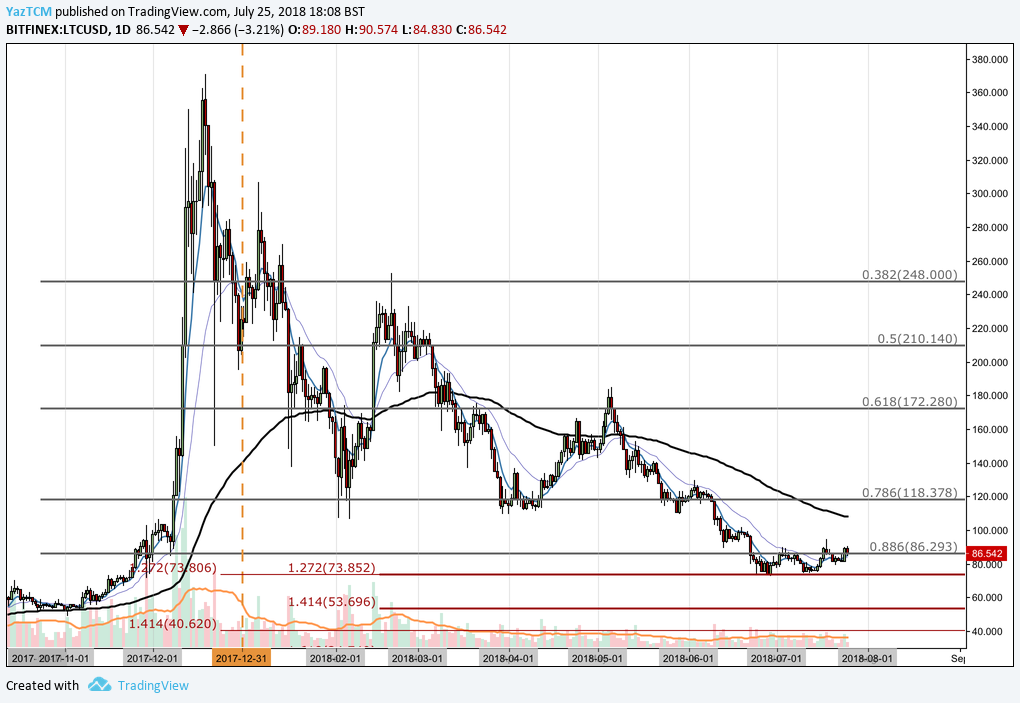
Analysing the market from the long term perspective above, we can see LTC had experienced a significant bullish run when it rose from a low of $48 on November 2nd 2017 and extended to an all time high priced at $370 placed on December 19th 2017.
The market went on to rapidly depreciate after placing this all time high, initially finding support at the 100 day moving average and the .618 Fibonacci Retracement priced at $172 in January. This is a Fibonacci Retracement measured from the entire bullish run previously mentioned.
Price action went on to plummet below the .618 Fibonacci Retracement and, consequently, the 100 day moving average during February until it found support at the .786 Fibonacci Retracement priced at $118. The market, largely, stayed above this level for the majority of the year until it broke further lower during June until it found support just below the .886 Fibonacci Retracement priced at $86.
We can notice that this level of support was bolstered by two downside 1.272 Fionacci Extensions of different lengths. This support proved to be a significant level for the bulls during July.
If the market does break below the 1.272 Fibonacci Retracement priced at $73 we can expect near term support to come in at the 1.414 Fibonacci Extension priced at $53.
Let us continue to analyse the market a little closer to highlight any further potential support and resistance zones.
LTC/USD – SHORT TERM – DAILY CHART
https://www.tradingview.com/x/HYHtagi7/
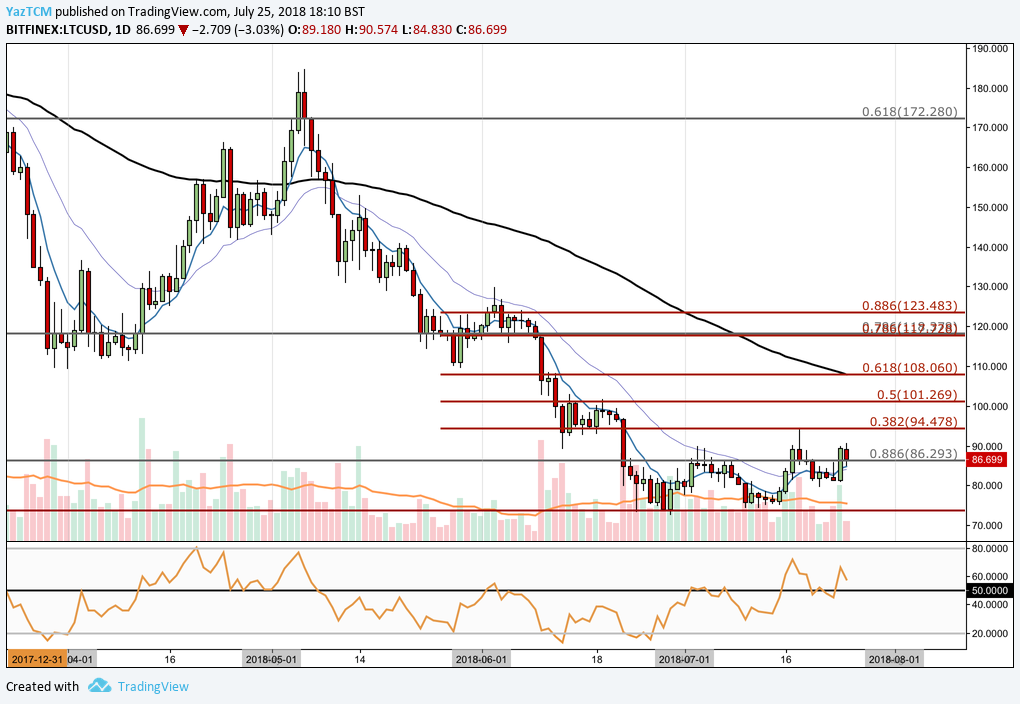
Anaysing the market from a closer time frame, we can see that the market is currently sitting at support right on the .886 Fibonacci Retracement level. If the bullish momentum can increase, we can expect near term resistance to be located at the bearish .382 Fibonacci Retracement level priced at $94.
Further resistance above this level can be expected at the downside .618 Fibonacci Retracement priced at $108. It is important to highlight that this level of resistance will require significant support to overcome due to the 100 day moving average also being located in this area further adding to the expected resistance.
The technical indicators are currently favouring the bulls in this market. The RSI is well above the 50 handle indicating that bullish momentum in increasing. For a bullish break upward, we need to see the RSI remaining above 50 and heading toward the oversold conditions.
Similarly, the moving averages are providing favour to the bulls at this moment in time. The 7 day EMA has recently crossed up above the 21 day EMA constituting to a bullish crossover. This indicates that the bullish pressure is increasing in the market and could signal a potential long term bullish run for LTC.
, and Stellar (XLM) Price Analysis – Recovery Expected Above Major Support Levels")
 and Stellar (XLM) Weekly Price Performance Overview")
