

Like most other cryptocurrencies, IOTA has continued to experience some downward pressure during the course of this week as prices drop by a total of 18.64% over the past 7 trading days.
IOTA is currently exchanging hands at a price of $0.9352 and is down by 4.32% over the past 24 hours. It is ranked 10th in terms of overall market cap across the entire industry with a market cap of $2.60 billion. This is down by $600 million from the $3.2 billion market cap seen last week.
The Internet of Things, IOTA, is said to be a third generation cryptocurrency. It’s codebase is not based off of blockchain. Instead, it uses a different type of distributed ledger technology known as Tangle. Tangle is a system where each node verifies each other’s work instead of a blockchain style system. With everyone playing an equal role within the system this removes the need for miners.
Tangle technology allows for faster transaction compared to Bitcoin. It also allows for micro-transactions, has no fees to use and is quantum resistant.
Let us analyse price action over the recent term and see how the market has been trading.
Price Analysis
IOTA/USD – SHORT TERM – DAILY CHART
https://www.tradingview.com/x/1TuxavyL/
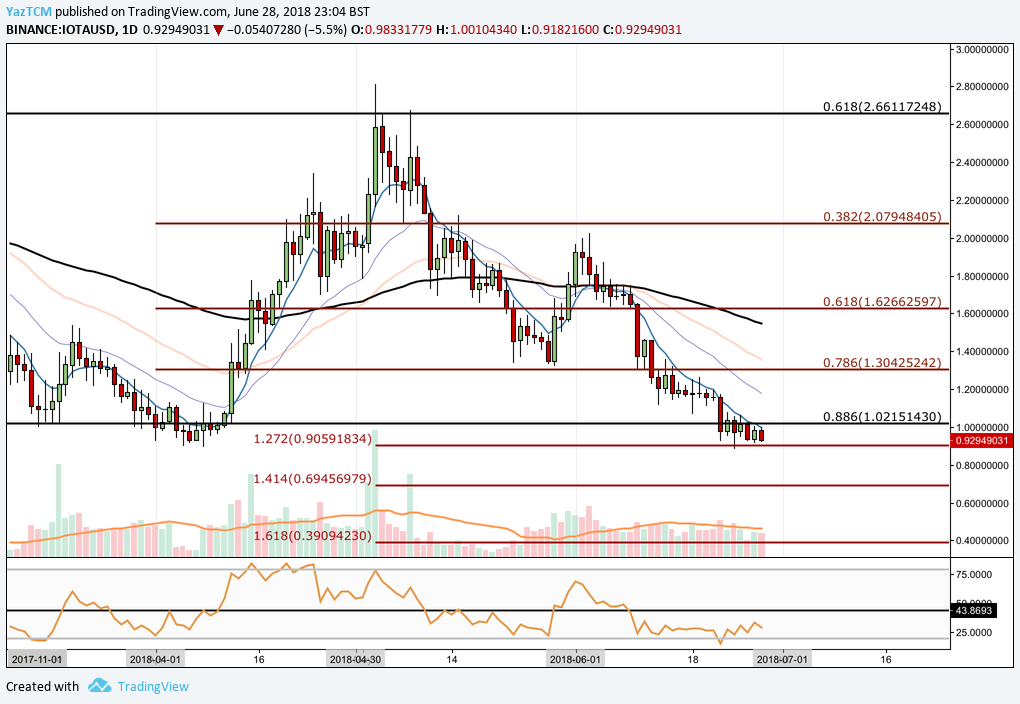
Analysing the price chart above, we can see that IOTA had experienced an epic bullish run during April when price action rose from a low of $0.88 in April to a high of $2.16 in early May. This constituted to over a 200% increase in price value from low to high.
Since placing this high in April, price action continued to roll over, initially finding support at the short term .786 Fibonacci Retracement (marked in red) at a price of $1.30. This is a Fibonacci Retracement taken from the entire bullish run seen during April.
Price action failed to hold above this level and fell to the .886 Fibonacci Retracement at a price of $1.02. This also coincides with a long term Fibonacci Retracement which bolsters the support found in this area.
The market has dipped slightly below this level and has found a serious level of support at a 1.272 Fibonacci Extension level priced at $0.90. This is a Fibonacci extension taken from the bearish leg seen during May. This level has also experienced strong support previously during the lows seen in April.
If the bears manage to push price action further below $0.90 then the nearest level of support can be found at the 1.414 Fibonacci Extension level pried at $0.69 followed by the 1.618 Fibonacci Extension level at a price of $0.39.
Alternatively, if the bulls can garner enough support in this area they may be able to push the market back toward near term resistance located at the .786 Fibonacci Retracement level at a price of $1.30. If price action can break above this level then it should be free to be able to attempt to retest the monthly highs priced at $2.
The technical indicators are largely favouring the bears in this scenario. The RSI has been trading well below the 50 handle for quite some time indicating the months of negative pressure seen. For the bearish pressure to fade, we would like to see the RSI cross back above the 50 handle.
Let us analyse how IOTA has been trading relative to BTC over the long term.
IOTA/BTC – LONG TERM – DAILY CHART
https://www.tradingview.com/x/ZjFBwi4y/
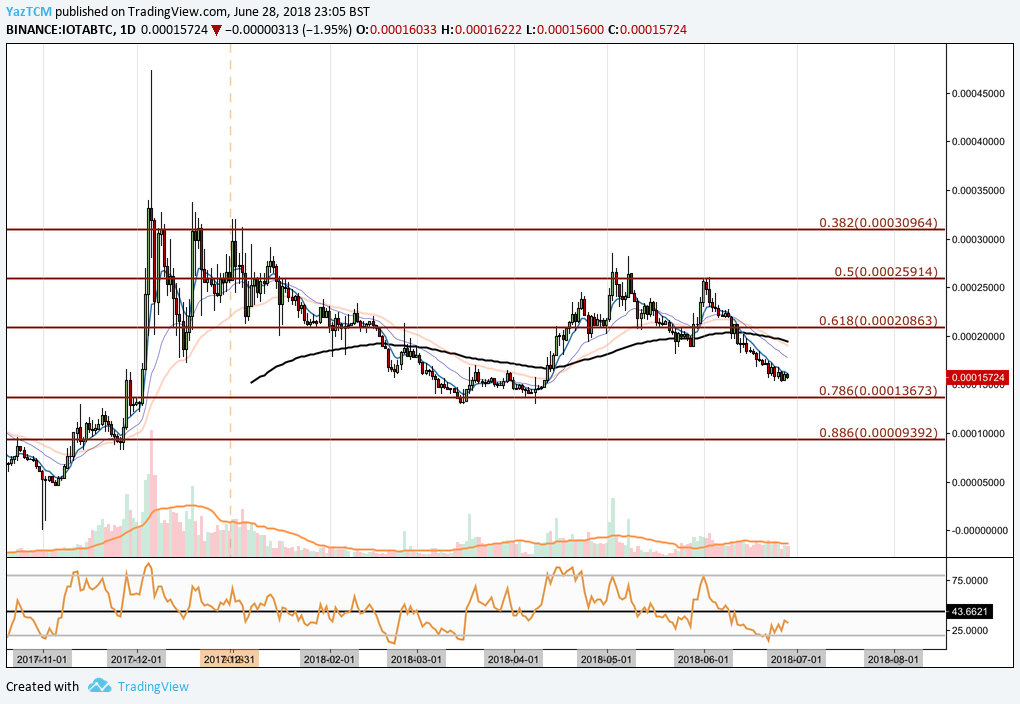
IOTA had needed the previous year of trading on an extremely bullish note as price action rose from a low of 4.7K SATS to a high of 33.1K SATS. For a brief period of time, a couple hours, this was over a 25,000% increase.
However, this bullish momentum began to fade and throughout the course of the year IOTA began to depreciate against BTC until it found support at the .786 Fibonacci Retracement priced at 13.6K SATS in March. This is a Fibonacci Retracement taken from the entire bullish run seen toward the end of 2017.
Price action rebounded shortly only to meet resistance at the .50 Fibonacci Retracement during May, at a price of 25.9K SATS. When June came along price action rolled over once again to where it currently trades at 15.7K SATS.
If the bearish sentiment continues, we would expect to see the nearest level of support to be at the .786 Fibonacci Retracement priced at 13.6K SATS.


