
 Technical Analysis #001 - Golem Reaches Long Term Support Level")
Golem has experienced a short price increase of 3.98% over the past 24 hours as the cryptocurrency currently trades at $0.2986, at the time of writing. This price increase comes after 7 trading days of declining prices as Gnt drops 15.81%.
Golem coin was created by Julian Zawitowski and was designed to become a decentralised supercomputer. The network would use a method of combined computing power to allow renters to donate their spare computation resources to the network and other users to come and loan out that computation power in their projects.
The Golem Network currently only allows users to the power for rendering tasks on the program Blender but have plans for many more integrations in the future.
Golem coin is currently ranked at 48th in terms of overall market cap with a value of $250 million. Golem has seen a sustained price drop over the past 30 trading days of 24.38%.
Let us continue to analyse price action over the long term.
Price Analysis
GNT/USD – LONG TERM – DAILY CHART
https://www.tradingview.com/x/BbptIWaX/
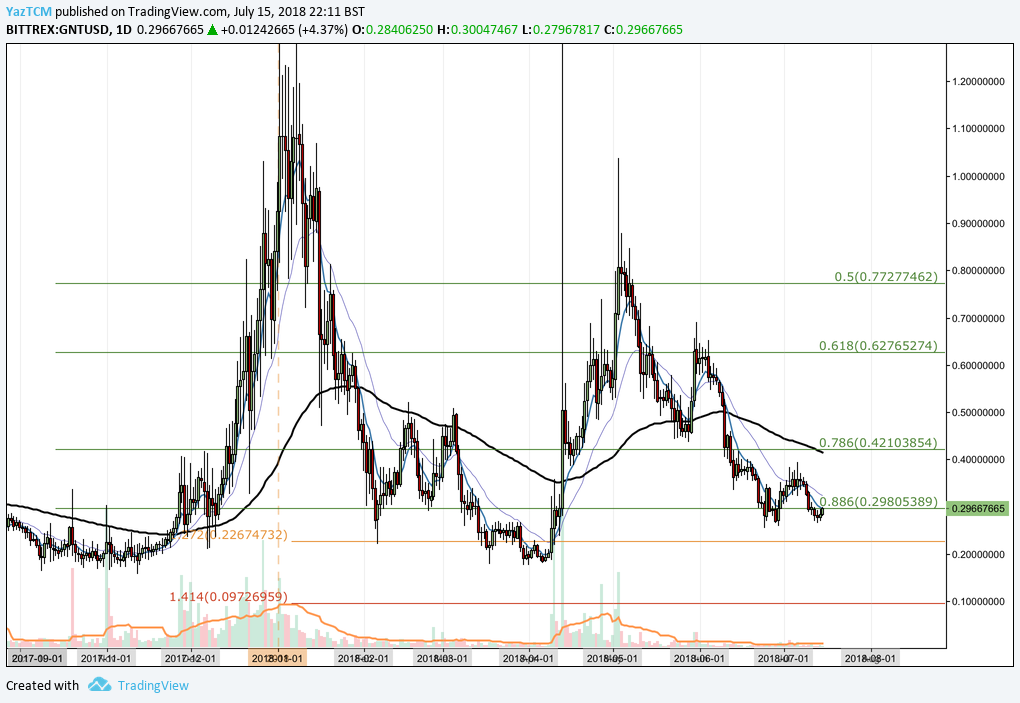
Analysing the market from the long term perspective above, we can see that Golem had experienced an incredible bullish run toward the end of 2017 when the market rose from a low of $0.15 on November 12th 2017 to an incredible high of $1.38 on January 2nd 2018. This was a price increase of 720% from low to high.
After placing this all time high, we can see that the market went on to fall, originally finding support at the .886 Fibonacci Retracement priced at $0.298 in February. This is a Fibonacci Retracement taken from the entire bullish run described above.
Except for a brief period in March, the market managed to stay above the .886 Fibonacci Retracement for the remainder of the year. We can see that price action is currently, once again, trading slightly below the .886 Fibonacci Retracement at $0.029. If the market continues lower, then near term support can be found at the downside 1.272 Fibonacci Extension priced at $0.2267.
Let us continue to analyse the market at a closer perspective to highlight further support and resistance areas.
GNT/USD – SHORT TERM – DAILY CHART
https://www.tradingview.com/x/D9LMeYI1/
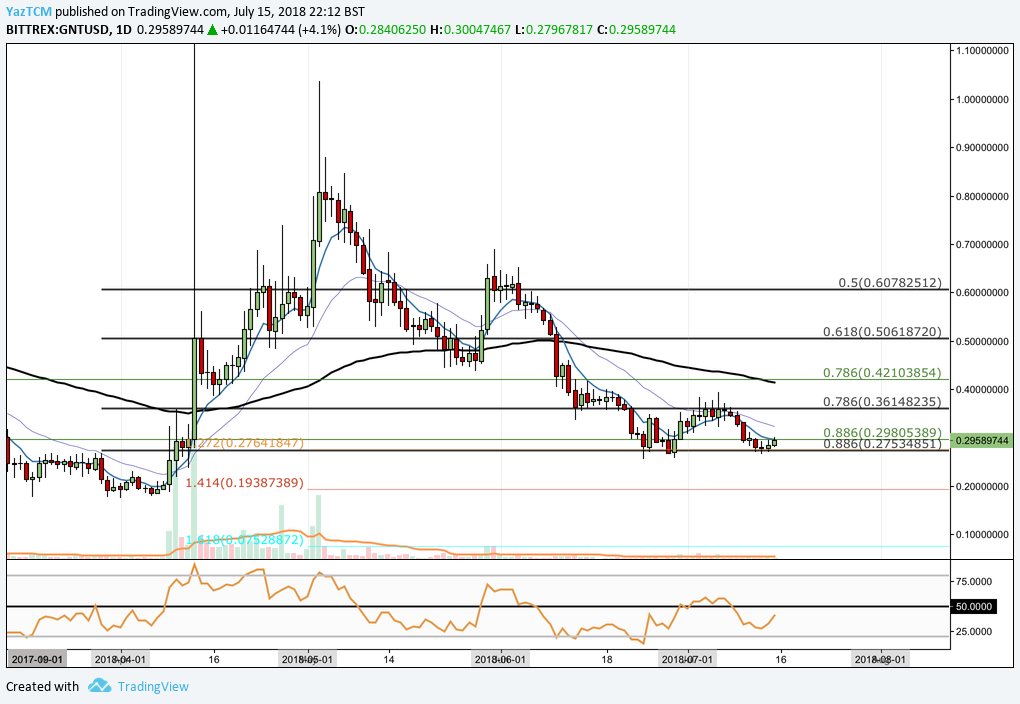
Analysing the market from a closer perspective, we can see that price action had experienced another bullish run during April when the market rose from a low of $0.17 on April 1st and extended to a high of $1.03 on May 3rd 2018. This was a price increase of over 500% from low to high.
We can also see that during April, the market spiked to an extreme high of $1.88. This was caused by Golem releasing their mainnet on this day, causing price to momentarily increase by 300% for a short few hours before returning back to its original trading price.
After placing the high, the market went on to fall during May and June until price action found support at the short term .886 Fibonacci Retracement priced at $0.02753. We can see that so far during trading in the month of July, the market has been trapped within a range between the short term .886 Fibonacci Retracement and the short term .786 Fibonacci Retracement priced at $0.361.
Price action is currently trading at support at the .886 Fibonacci Retracement, if the bulls can push the market above the .786 Fibonacci Retracement then we can expect near term resistance to be located at the long term .786 Fibonacci Retracement priced at $0.421. The resistance in this area is also bolstered by the 100 day moving average adding to the expected resistance in this area.
Alternatively, if the market slips below the .886 Fibonacci Retracement then near term support can be located at the 1.414 Fibonacci Extension priced at $0.19.
The technical indicators within this market are favouring the bears at this moment in time but are slowly leaning toward the bulls. The RSI is trading below the 50 handle and has been here for the majority of the month indicating the bearish momentum within the market. If the RSI can eventually break above the 50 handle this would indicate that the bullish momentum within the market is increasing.
, and Stellar (XLM) Price Analysis – Recovery Expected Above Major Support Levels")
 and Stellar (XLM) Weekly Price Performance Overview")
