Supply levels: $102, $110, $118
Demand levels: $92, $84, $76
ETH/USD Medium-term Trend: Ranging

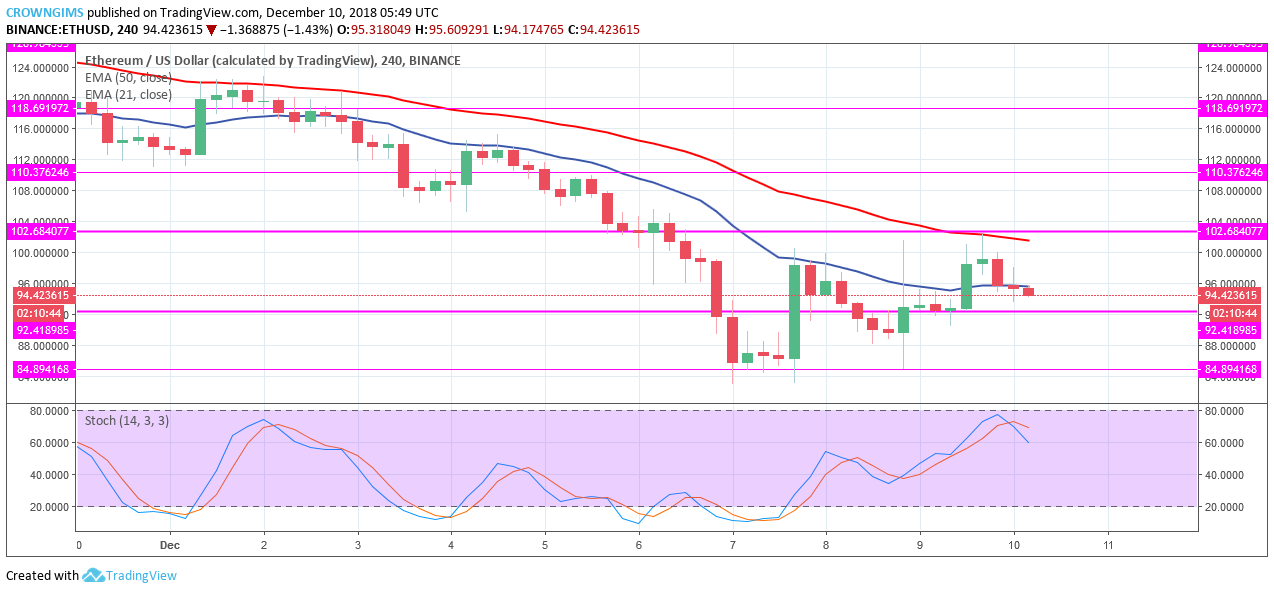
ETH/USD is ranging on the medium-term outlook. The cryptocurrency has been on the losing end for more than a week. On December 7, it fell to the demand level of $84, consolidated for some time at the same level before the bulls gained pressure and pushed the coin up, broke the former supply level of $92 and pushed it towards $102 price level. It was resisted and fell to previous low. Yesterday, the coin was range-bound between the supply level of $102 and the demand level of $92.
The coin is found flipping in between the 21-day EMA and 50-day EMA within the range with the later above the coin. The two EMA are closely parallel to each other as a sign of consolidation on the ETH market. Nevertheless, the Stochastic Oscillator period 14 is above 60 levels with the signal lines bend down which connotes sell signal.
Bearish momentum will be anticipated towards the price levels of $84 – $76 in case there is a clear breakout of ETH price below the demand level of $92. In like manner, a breakout above the supply level of $102 will expose the coin to $110 price level.
ETH/USD Short-term Trend: Ranging

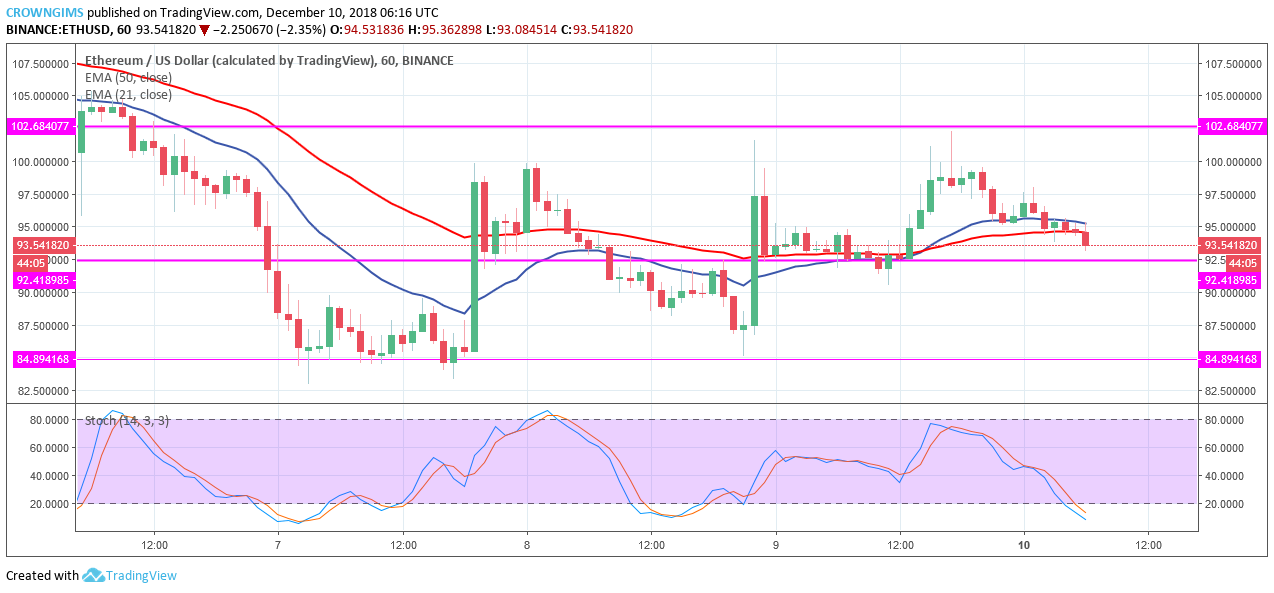
ETH is ranging in its short-term outlook. ETH bottomed at the previous low of $84 demand level on December 18 in which a bullish pin bar formed returned the price toward the $102 price level after the former supply level of $92 is broken upside and then the coin started a ranging movement between the supply level of $102 and the demand level of $92.
The price is currently between the two EMAs well closed to each other and the two EMAs are parallel showing no direction connotes that consolidation is ongoing. However, the Stochastic Oscillator period 14 is below 20 level with signal lines points to the south indicate further selling of ETH.


