

The current Ethereum weekly timeframe paints a very interesting picture. And it seems as though ETH is currently in a crucial area of determining whether $178 can hold as support.
For those that can remember the accelerated pace at which ETH increased during May 2017 will also recall another key zone.
Can YOU remember it?
An instant reversal from the highs of $350 brought ETH back down to the key zone around $178 – The level ironically we hover around now.
Some may say manipulation at it’s finest.
I can neither confirm nor deny…
Ethereum Price Analysis
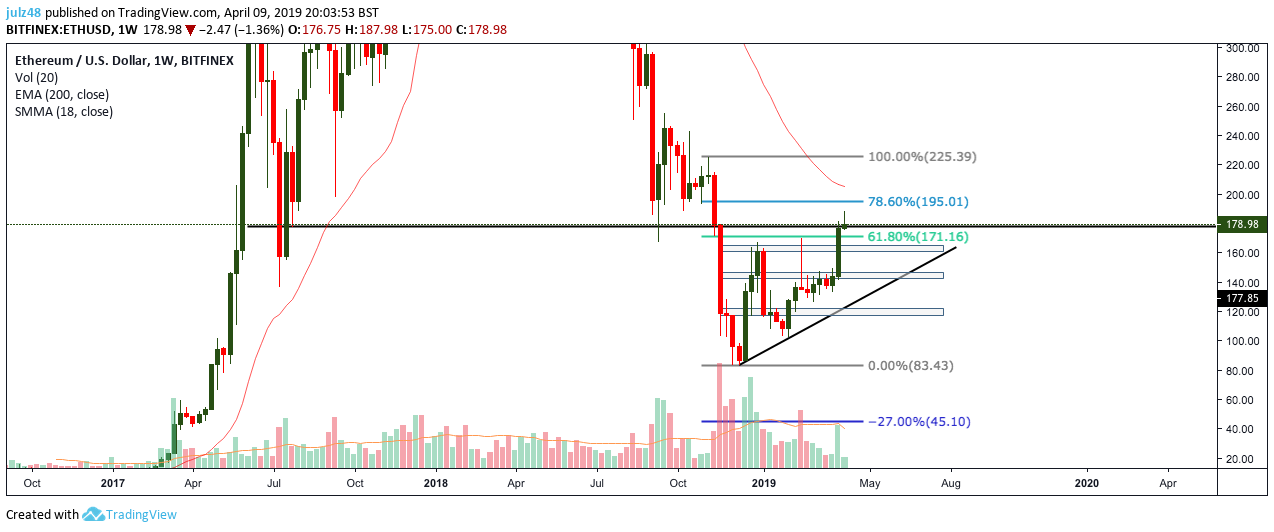
Since finding support at the lows of $85 in December, ETH has steadily been on the rise creating a lower high and breaking past key levels of resistance at $120 & $140.
We now sit at a current resistance level at $178 to suggest the bulls may have run out of impetus to push higher. Or perhaps it may be a level Ethereum can overcome?
Ethereum, quite like Bitcoin has followed in very similar patterns both mimicking each other in pushing past key resistance levels and approaching significant zones.
My next question would lead many to believe, is Ethereum in line for a potential reversal?
Ethereum in line with Fibonacci Tool
The Fibonacci tool currently indicates ETH is consolidating around the 61.8 fib at $170 and now approaching the 78.6 fib at $195.
If ETH is able to break through resistance and test the 78.6 fib I will like to see how price reacts from this area in which the 18D MA may act as stern resistance.
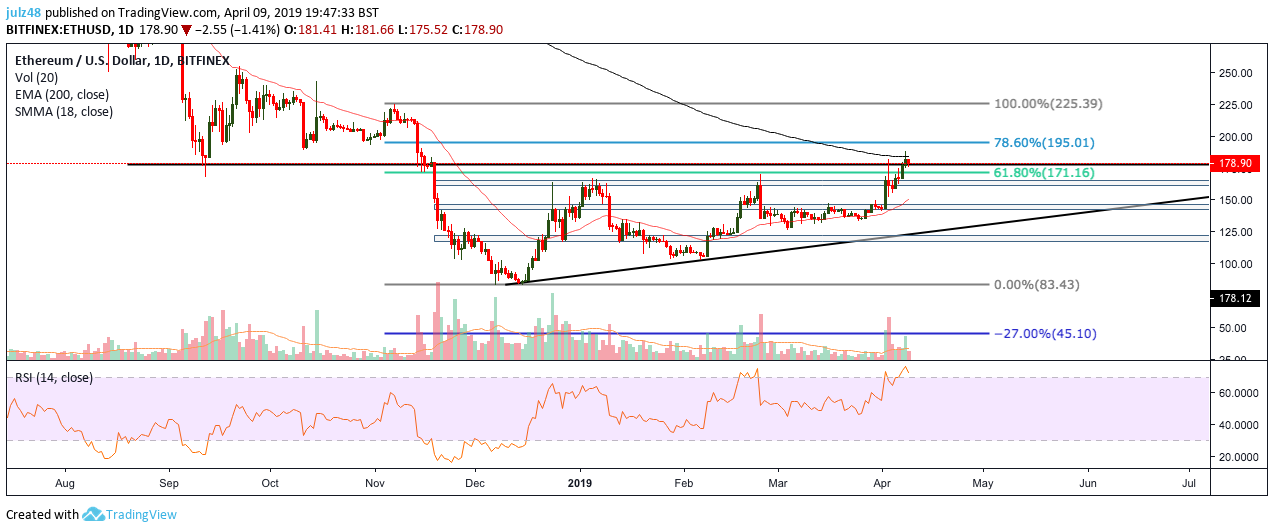
The Daily chart, however, gives a much more detailed insight with the 200D MA acting as resistance, which could be pivotal if ETH fails to break through.
Considering the RSI is currently showing as overbought, the bears could use this opportunity to drive the price down, which could mean Ethereum could revisit $160 or $140 once again.
Would this confirm the reversal in question?
If Bitcoin reverses then surely it is inevitable Ethereum will follow the pattern.
The trendline could also become key as I believe a reversal in price and slow down in volume could once more lead to a retest of the $120 level.
The next few days or week will prove key to seeing which direction Ethereum takes next.


