
 Price Prediction and Analysis - January 24")
Supply levels: $131, $145, $164
Demand levels: $115, $101, $90
ETH/USD Medium-term Trend: Bearish
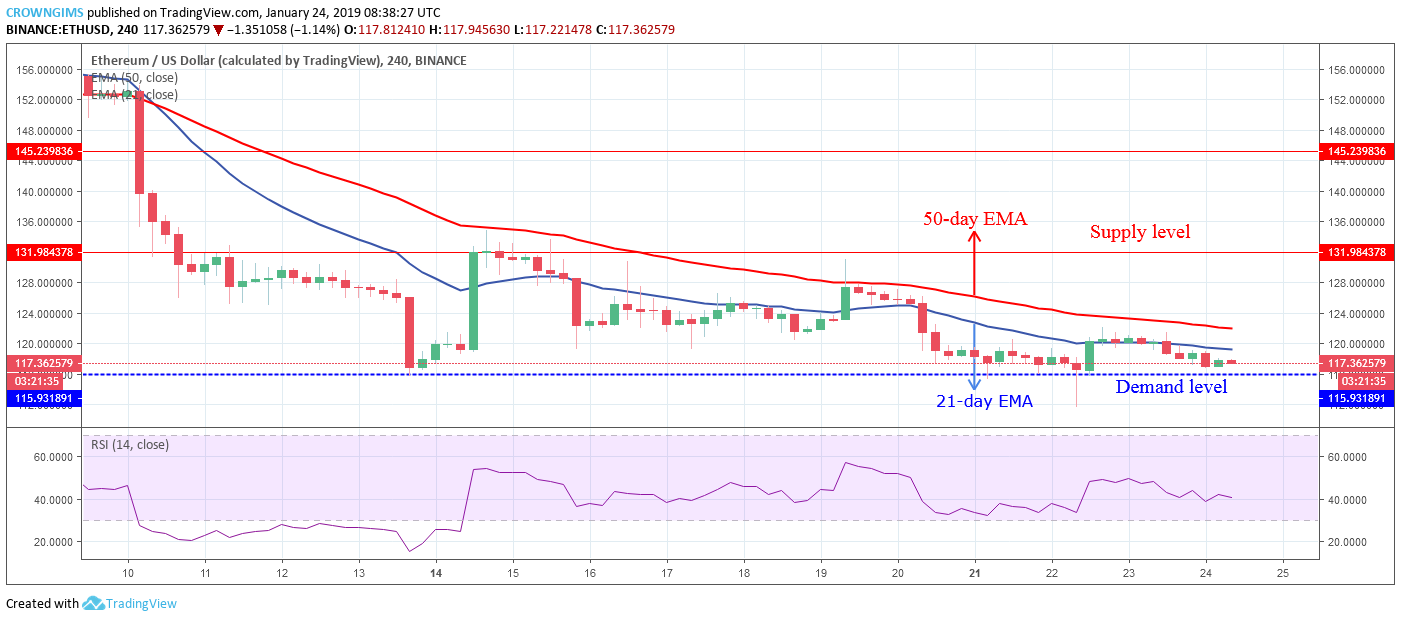
ETH/USD is on the bearish trend on the medium-term outlook. The bearish engulfing candle formed on the 4-Hour chart on January 10 pushed the ETH price down and bottomed at $115 price level on January 13 after broken down the former demand level of $145 and $131. The Bulls defended the $115 demand level and the price rallied towards $131 supply level, the Doji candle formed followed by bearish candle returned the coin to the demand level of $115.
The 21-day EMA has crossed the 50-day EMA downside since January 10 as evidence of trend change and the ETH price has equally traded below the two EMAs except when there was a pullback. The Relative Strength Index period 14 is at 40 levels with the signal line points down which indicates the sell signal. In case the demand level of $115 does not hold the ETH price may find its support at $101 – $90 demand level.

ETH/USD Short-term Trend: Bearish
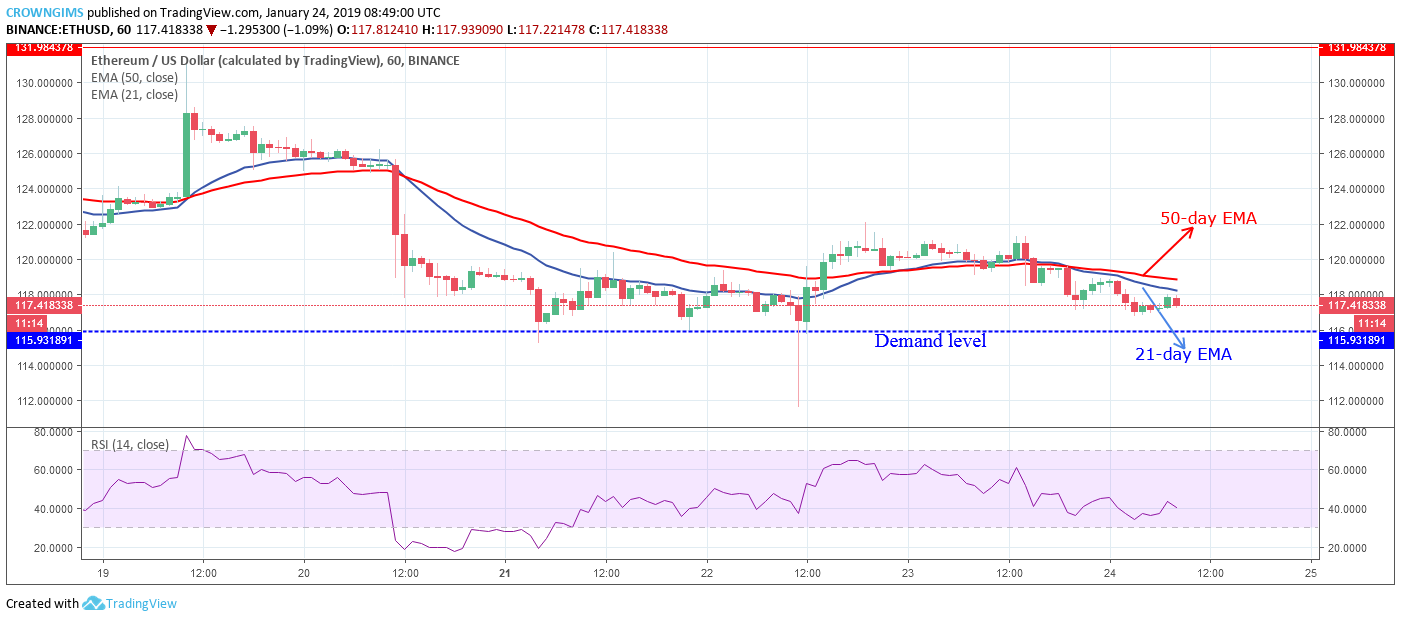
ETH is on the strong bearish trend on the short-term outlook. The sporadic increase of ETH price on January 19 aided by the bulls’ momentum reached the $131 supply level. The Bulls lose the pressure and the strong bullish candle was reduced to a long upper tailed candle in which it was followed by bearish candles which decreased the ETH price. The sudden and sharp price declination occurred on January 20 indicates another level of bearish momentum which bottomed the coin at $115 demand level. Presently, the sideways movement is ongoing around $115 price level.
The ETH price is trading below the 21-day EMA and the 50-day as a symbol of a bearish market. The Relative Strength Index period 14 is at 40 levels and its signal line pointing to the south which indicates ETH price may fall further. Should the bulls defend the demand level of $115, the ETH price will rally towards $131 price level.


