
 Price Analysis November 6")
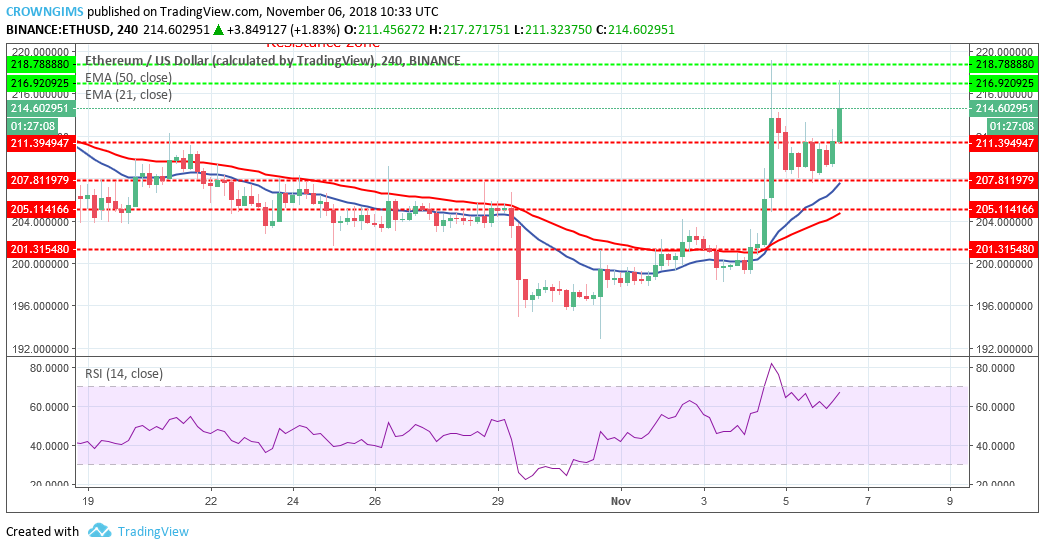
Supply levels: $216, $218, $222
Demand levels: $211, $207, $205
ETH/USD Medium-term Trend: Bullish

Ethereum is bullish on the medium-term. The cryptocurrency consolidated yesterday after the sudden uptrend movement scenario that happened on November 4th, when there was a bullish engulfing candle formation at the demand level of $201, the ETH price rallied to the north and found its high at the supply level of $218.
The price was pushed down below the price support level of $211, after which it started consolidation.
The first two candles that open today’s market are bullish engulfing candle which indicates the bulls’ increased momentum that increased the price, broke the yesterday’s supply level upside and rally towards $216 supply level.
ETH price is currently above 21-day EMA and 50-day EMA which indicates that an uptrend movement is ongoing. In addition, the relative strength index period 14 is above 60level with its signal lines pointing to the north which connotes the buy signal.
ETH/USD Short-term Trend: Bullish
ETH/USD is bullish on the 1-Hour chart. Yesterday, ETH price was pushed up after the price pull back from the demand level of $207 and the coin broke the former supply level of $211 moved towards $216 price level where it completed the cup shape pattern. Retracement is a must because of the completion of the cup shape pattern for the coin to gather enough momentum for further uptrend movement.

Currently, retracement is ongoing. ETH Price is above 21-day EMA and the 50-day EMA which indicate uptrend movement. Nonetheless, the RSI 14 is at 60 levels with its signal lines pointing downward which indicates the possibility of temporary bearish movement which may be a pullback.


 Price Analysis: Currency Likely to Skyrocket Above $160")