
 Price Analysis Currency is Approaching a point of a Major Decline")
Supply zones: $223, $234, $249
Demand zones: $209, $204, $190
ETH/USD Medium-term Trend: Bearish
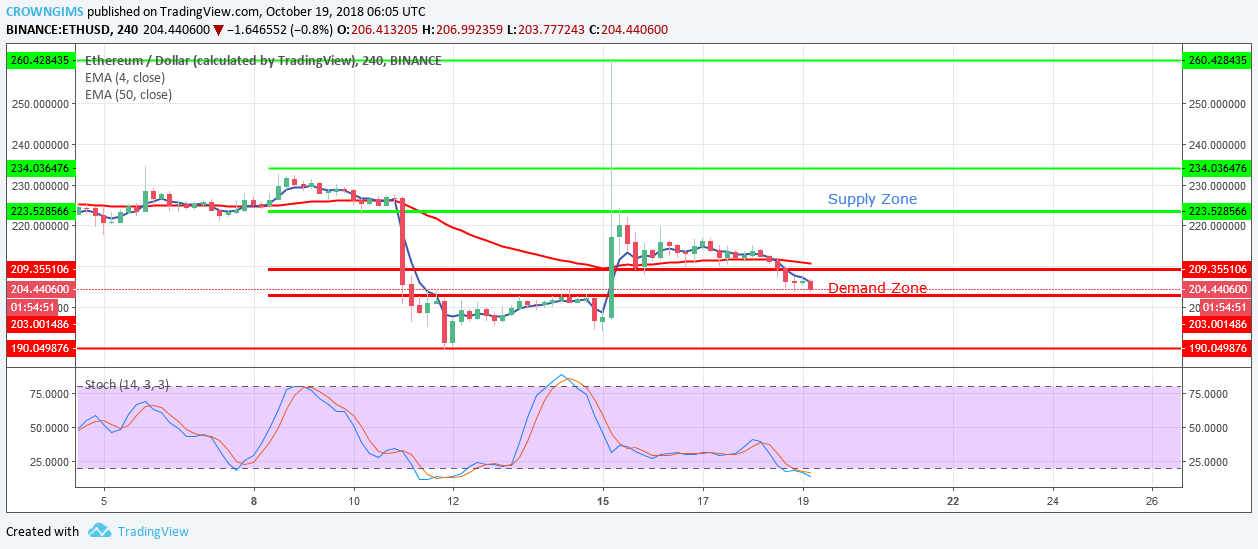
Yesterday, October 18, the cryptocurrency was ranging within the bound range of the supply zone of $223 and the demand zone of $209. Today, the price of the cryptocurrency is falling as it has broken the demand zone of $209, approaching the previous low of demand zone of $204.
In case the bears increase their momentum and the coin breaks the demand zone of $204, then it will find its low at the demand zone of $190. If the price falls to the demand zone of $190, traders should look out for buy setups to initiate long trades.
ETH is below the 4-day EMA and 50-day EMA with the two EMAs separated from each other, which indicates that the price is falling. Nevertheless, the Stochastic Oscillator period 14 is below 20 levels, which indicates that the market is oversold suggesting the bulls to take control of the market.
ETH/USD Short-term Trend: Bearish
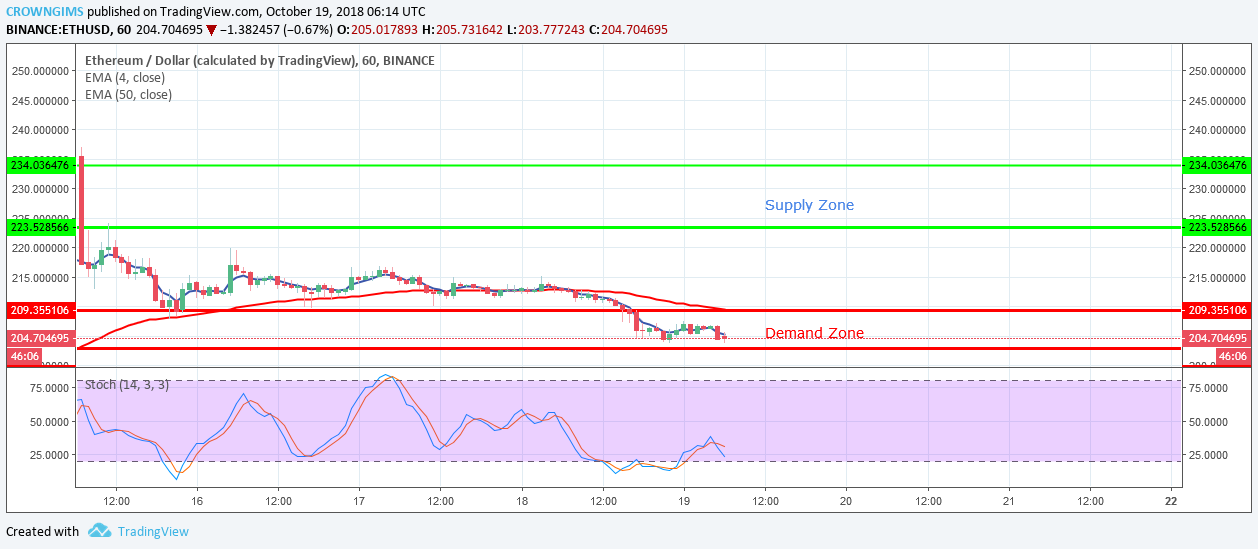
ETH/USD is bearish in its short-term outlook. ETH broke out from the range bound zone the pair was for more than three days ($223 – $209). The bears’ Pressure pushed the price below the lower level of the range ($209) and exposed the pair to the demand zone of $204. In case the demand zone of $204 holds the price may bounces and the market may return to its uptrend movement.
The market is below 4-day EMA and 50-day EMA which indicates the bearish trend is ongoing. Nevertheless, The Stochastic Oscillator period 14 is above 40 levels with signal lines points to the south which indicates a sell signal.


