
 Price Analysis Bouncing Back To The North Soon")
Supply levels: $202, $205, $207
Demand levels: $194, $191, $188
ETH/USD Medium-term Trend: Bearish
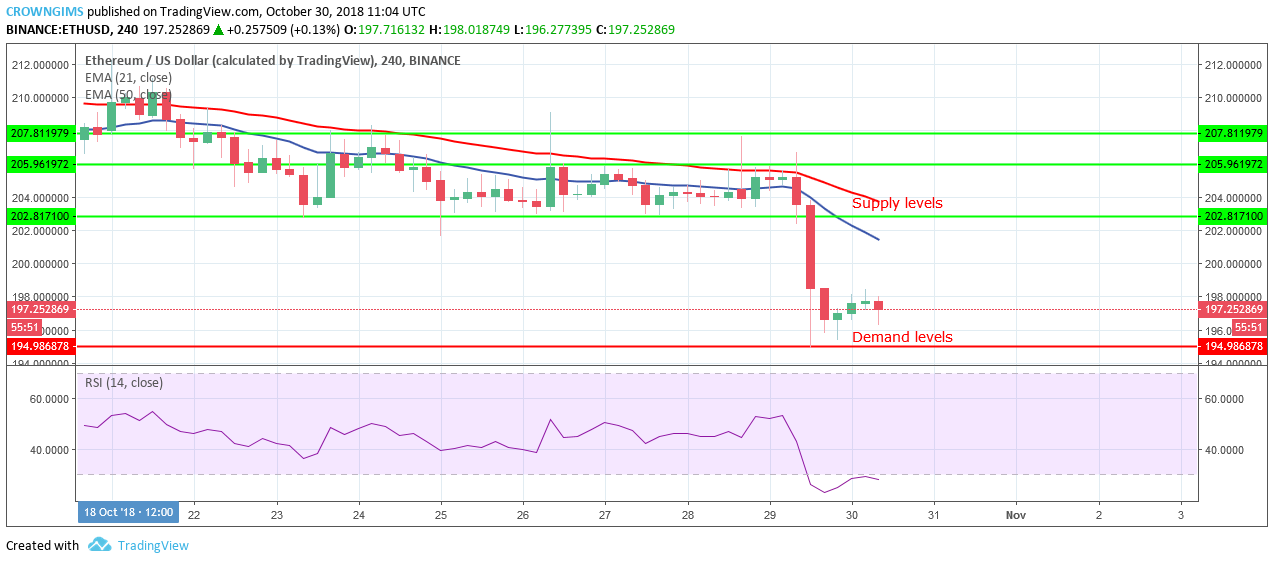
ETH/USD continues its bearish trend on the medium-term. The coin moved to the south with full momentum yesterday.
On October 28, the bulls made an attempt to push the ETH higher to the supply level of $207, the attempt failed by the pressure of the bears that return the price below $205 price level, the candle later formed inverted pin bar and the bearish movement commenced. Yesterday, the ETH price fell to the low level of $194 demand level with strong massive bearish candles.
The ETH price is below 21-day EMA and 50-day EMA which indicates that a bearish trend is ongoing. Nevertheless, the relative strength index period 14 is below 20level (oversold region) which indicate the market is oversold and the bulls may take over. However, the breakdown side of the ETH of the demand level of $194 will make the demand level of $191 the next target.
ETH/USD Short-term Trend: Bearish
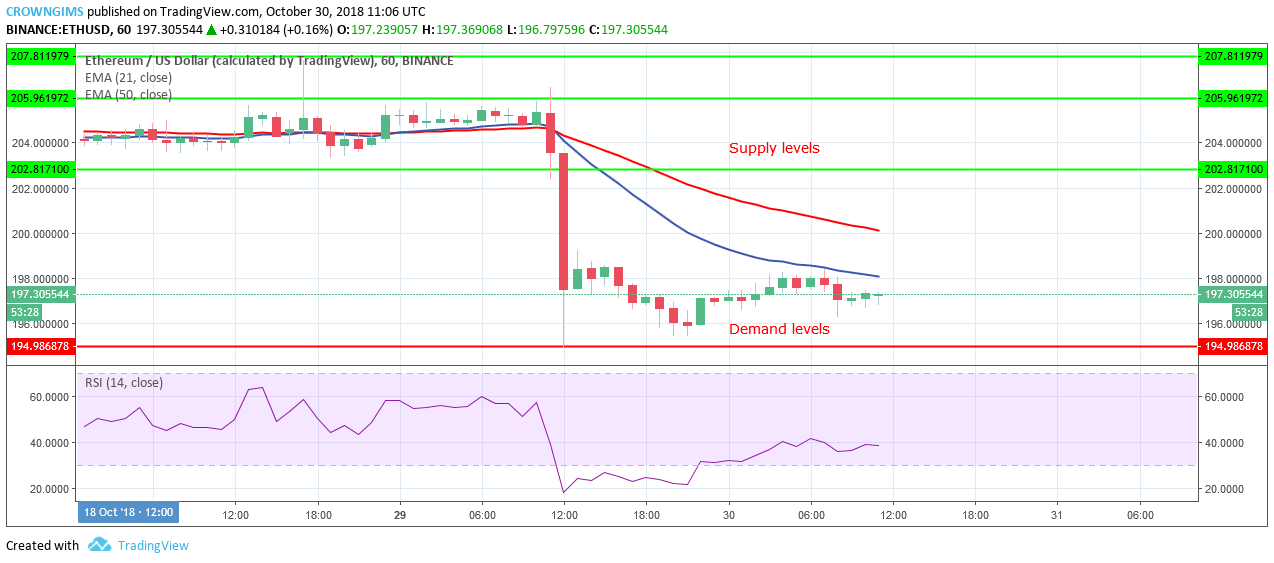
ETH/USD is bearish on the 1-Hour chart. The coin broke out from the consolidation zone yesterday. ETH consolidated for many days within the bound range of $205 and $202price levels. A strong bearish movement was made that broke the yesterday demand level of $202 downside to the low demand level of $194.

There was a pullback by the bulls to retest the dynamic resistance of 21-day EMA. The Price is below 21-day EMA and the 50-day EMA which indicate downtrend is ongoing. The RSI 14 is below 40 levels with its signal lines pointing downward which indicates the possibility of further downtrend movement.
, and Stellar (XLM) Price Analysis – Recovery Expected Above Major Support Levels")
 and Stellar (XLM) Weekly Price Performance Overview")
