

EOS has seen an 11.90% price drop over the past 24 hours of trading. This price drop comes as BTC falls back under $7,000 as the bears step up the pressure and considering that the majority of the altcoins are BTC driven their dollar value erodes as BTC drops.
Eos is currently exchanging hands at a price of $5.12 after seeing a 13% price decrease over the past 7 trading days. The 14 month old coin is ranked at 5th position in terms of overall market cap across the entire industry. It has a market cap value of $4.64 billion after suffering a 63% price drop over the 90 trading days.
Let us continue to analyse price action over the past couple of months and update our support and resistance areas.
Price Analysis
EOS/USD – SHORT TERM – DAILY CHART
https://www.tradingview.com/x/VZ3bbxgV/
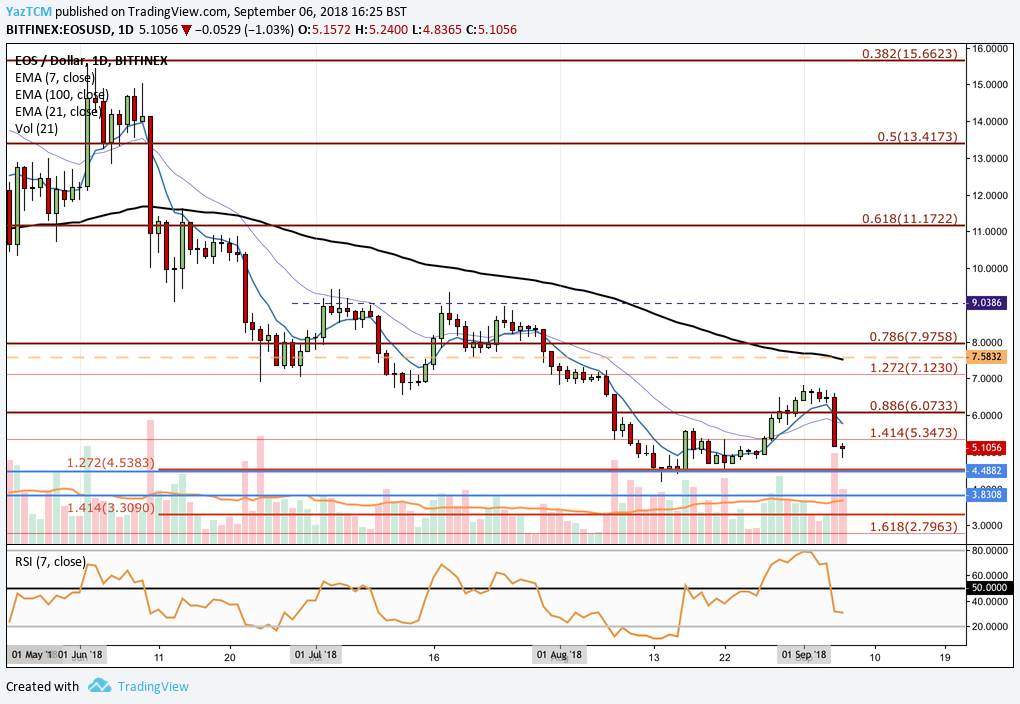
Analysing price action from the short term perspective above, we can see that the market dropped further lower than our expected support level of $6.07 outlined in our last article.
In fact, price action continued to drop further lower until it found support at the March low day close price of $4.48 during August. This area of support was bolstered by a short term downside 1.272 Fibonacci Extension level priced at $4.53. We can see that price has since rebounded and created a small bullish run before rolling over today.
Today, price action has rolled over and dropped back below $6 to trade at $5.10. If the bearish action continues over the next few days we expect immediate support to be located at the March day close price of $4.48.
If the increased bearish action can continue even further we expect more resistance to be located at the $4 psychological round number handle and then the March low price of $3.83.
The technical indicators within the market are currently learning towards the bears at this moment in time. We can see that the RSI has dropped below the 50 handle after trading in overbought conditions for a few months. If the RSI remains under 50 we can expect this market to continue further lower.
Let us continue to quickly analy price action a little closer from a closer timeframe.
EOS/USD – SHORT TERM – 4HR CHART
https://www.tradingview.com/x/LlY57rTt/

Analysing price action from the short term perspective above, we can see that the recent bullish action pushed price action from a low of $4.50 on the 22nd of August 2018 to a high of $6.82 on the 1st of September 2018. This was a price increase of over 50% from low to high.
We can see that after placing this high, price action rolled over and started to decline. It has found support at the .786 Fibonacci Retracement level priced at $5.00. This FIbonacci Retracement is measured from the small bullish run outlined above.
If the bearish price action can continue to push the market below $5, we expect immediate support below to be located at the .886 Fibonacci Retracement level priced at $4.76. Further support below this level will then be located at the initial start of the recent bull run, on the 22nd of August 2018, priced at $4.50.
Alternatively, if the bulls can regather momentum and push price action higher we expect immediate resistance to be located at the .618 Fibonacci Retracement priced at $5.39. Further resistance above this level can then be expected at the .5 and .382 Fibonacci Retracement levels priced at $5.66 and $5.93 respectively.


