
 - November 01, 2018")
Distribution territories: $0.073, $0.075, $0.081
Accumulation territories: $0.069, $0.064, $0.060
ADA/USD Medium-term Trend: Bearish
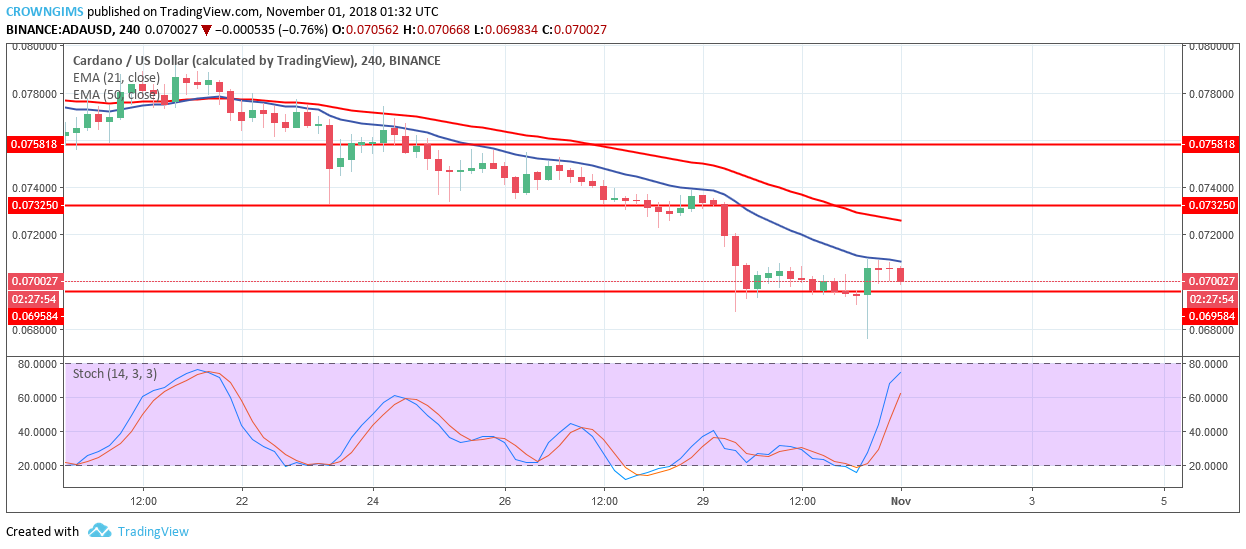
Cardano continues in its bearish trend. The dramatic fall of the coin from distribution territory of $0.073 to the accumulation territory of $0.069 on October 29 led ADA to consolidation throughout the following day. As predicted, ADA price broke out of the consolidation by broken the accumulation territory of $0.069 downside yesterday and move the ADA price towards the low accumulation territory of $0.064.
The bulls prevented further decrease in price, took over the market and pushed the price up to the former position to hit the dynamic resistance of 21-day EME above the $0.069 price level.
The coin with bearish candles is below the 21-day EMA and 50-day EMA which imply more sellers are in the market with high strength in the context of the trend.
However, Stochastic Oscillator period 14 is above 60 levels with its signal lines pointing to the north, which indicates upward movement. In case the bears increase and maintain their momentum, ADA price will break out the accumulation territory of $0.069 downside and the coin will continue its downtrend to $0.064.
ADA/USD Short-term Trend: Bearish
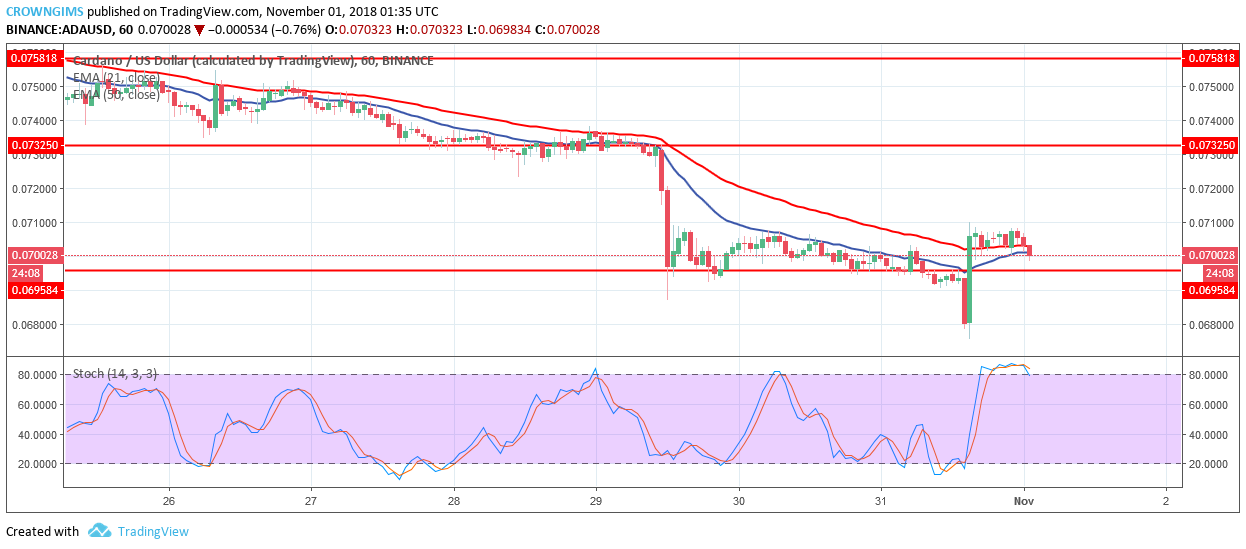
Cardano is still in its bearish trend on the 1-Hour chart. The bears moved the price downside by broke the accumulation territory of $0.069 toward $0.064 price level, the bulls pushed it back to the former position above the accumulation territory of $0.069 yesterday.
Currently, ADA price is below 21-day EMA and the 50-day EMA which implies downtrend. However, Stochastic Oscillator is above 80 levels (Overbought region) with signal lines pointing to the south which indicates a sell signal.


