
 Price Analysis The Bulls Are About to Trigger a Major Price Spike")
ADA/USD Price Medium-term Trend: Bullish
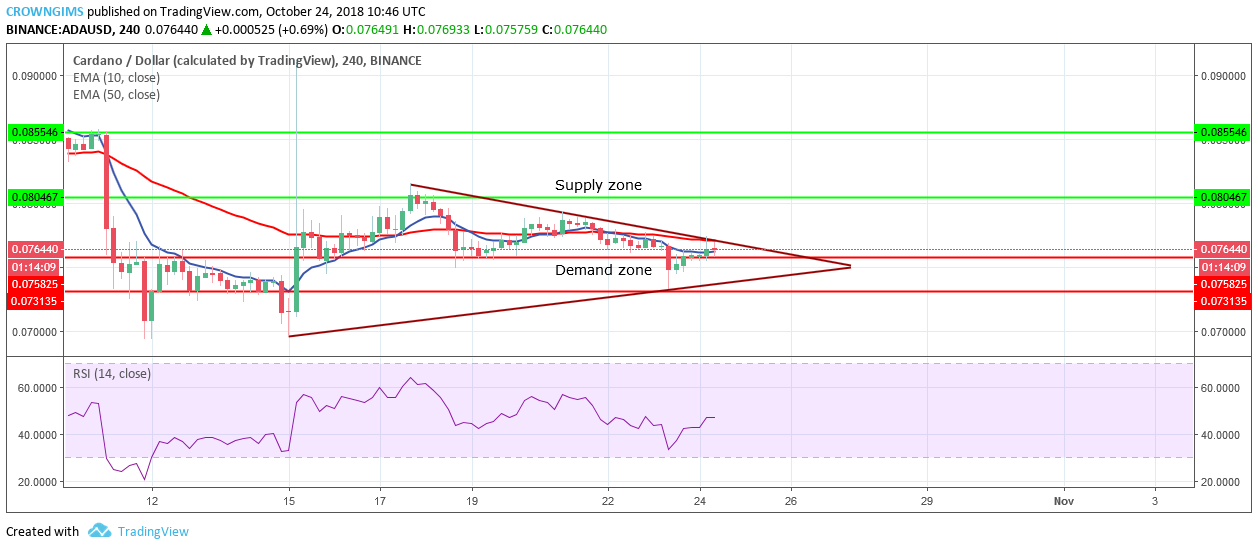
Supply Zones: $0.080, $0.085, $0.092
Demand Zones: $0.075, $0.073, $0.070
ADA is bullish in its medium-term outlook. The coin was bearish yesterday on 4-Hour chart; the bears broke downside the demand zone of $0.075 with the formation of a bearish engulfing candle. The ADA price was stopped at the demand zone of $0.073 by the bulls’ momentum which is clearly seen as the long bottom wick bearish candle (indicating the reversal of the price).
The bulls were able to push the price up above the supply zone of $0.08 yesterday. The increase in price continues today, meanwhile, the formation of symmetrical triangle pattern has been confirmed on the 4-Hour chart.
The cryptocurrency is ranging and trading between $0.080 in the upper supply area and at $0.075 in the lower demand area of the range. Patience is needed for a defined trend to show up. This means a breakout at the upper resistance trend line area of the symmetrical triangle will be a good buying opportunity or a breakdown at the lower support trendline area will be a selling opportunity.
ADA/USD Short-term Trend: Bullish
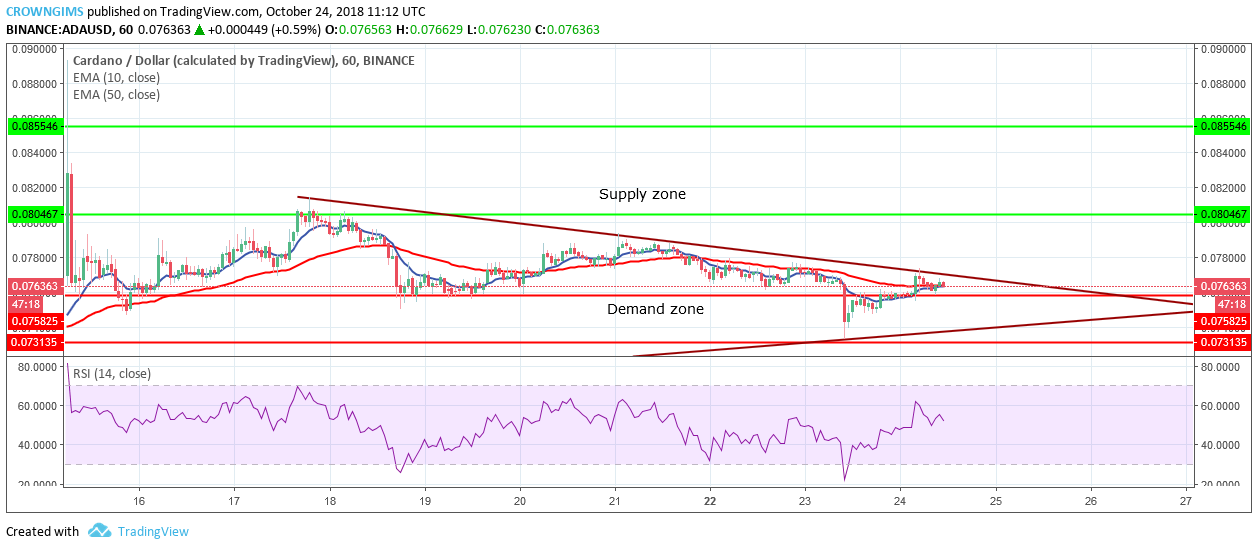
ADA/USD on the short-term outlook is bullish. ADA price moved up as it was rejected by the bulls at the demand zone of $0.073 yesterday. The formation of symmetrical triangle pattern also confirmed on 1-Hour chart; this means that there could be a breakout at the upper resistance trend line area of the symmetrical triangle or a breakdown at the lower support trendline area of the symmetrical triangle.
ADA is currently above the 50-day EMA and the 10-day EMA which is crossing the 50-day EMA upward. The RSI 14 is above 50 levels with the signal line pointing downwards which indicate sell signal.
 Price Up 62% From Bottom, Can The Bulls See More Gains?")

