
 Price Analysis Continues to Fall Within the Boundaries of its 6 Week Trading Range")
Cardano has seen a small -1.3% price decline over the past 24 hours of trading. The cryptocurrency is currently exchanging hands at a price around $0.074 after experiencing a nice 8.62% price increase over the past 7 trading days.
Cardano, the white paper based project from IOHK, is still currently developing along the roadmap of its Project Shelly phase. Shelly is designed to make Cardano a fully decentralised and fully autonomous blockchain. Project Shelly is undergoing rigourous testing so teh ADA team can ascertain strong benchmarks as to what the ADA blockchain can handle.
The team have also recently released their Rust Project this week. Rust is a lightweight programming language that can be compiled in both Android and iOS operating systems. The Rust Project will aid developers as it provides a toolbox for coders to develop decentralised applications on top of the ADA blockchain via the Rust SDK.
Cardano is currently ranked in 9th position in terms of overall market cap across the entire industry. It has a total market cap value of $1.93 billion after the 12 month old coin sees a 45% price drop over the past 90 trading days. Cardano is currently exchanging hands at a price that is 93% lower than its all time high value.
Let us continue to analyse price action for Cardano over the long term.
Price Analysis
ADA/USD – LONG TERM – DAILY CHART
https://www.tradingview.com/x/MZ8Vko8m/
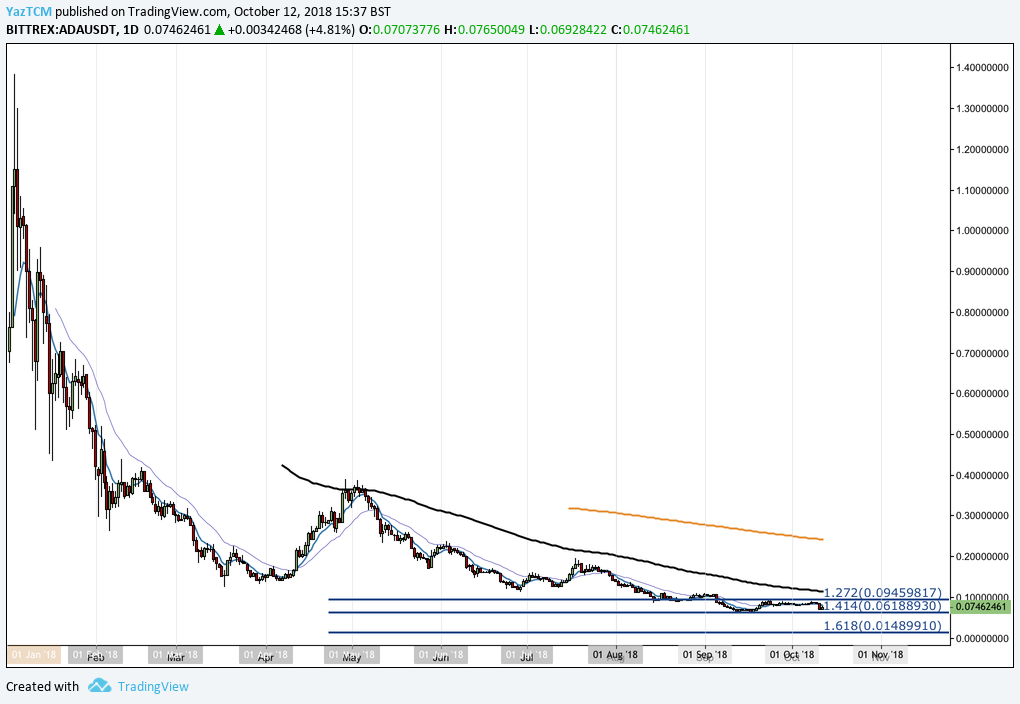
Analysing price cation over the long termed perspective above we can see that the trading year has not been kind to ADA. The market has been consistently dropping since its inception and it did not help that ADA launched during the peaks of the overall cryptocurrency markets.
We can see that the market has been consistently falling as the year has progressed. It has recently found support at a downside 1.414 Fibonacci Extension level priced at $0.06188 during August 2018 which helped to stabilise the market as price action has not yet managed to penetrate below this level.
Let us continue to analyse price action a little closer over the shorter period and highlight any further potential support and resistance areas.
ADA/USD – SHORT TERM – DAILY CHART
https://www.tradingview.com/x/6FrkmJHk/
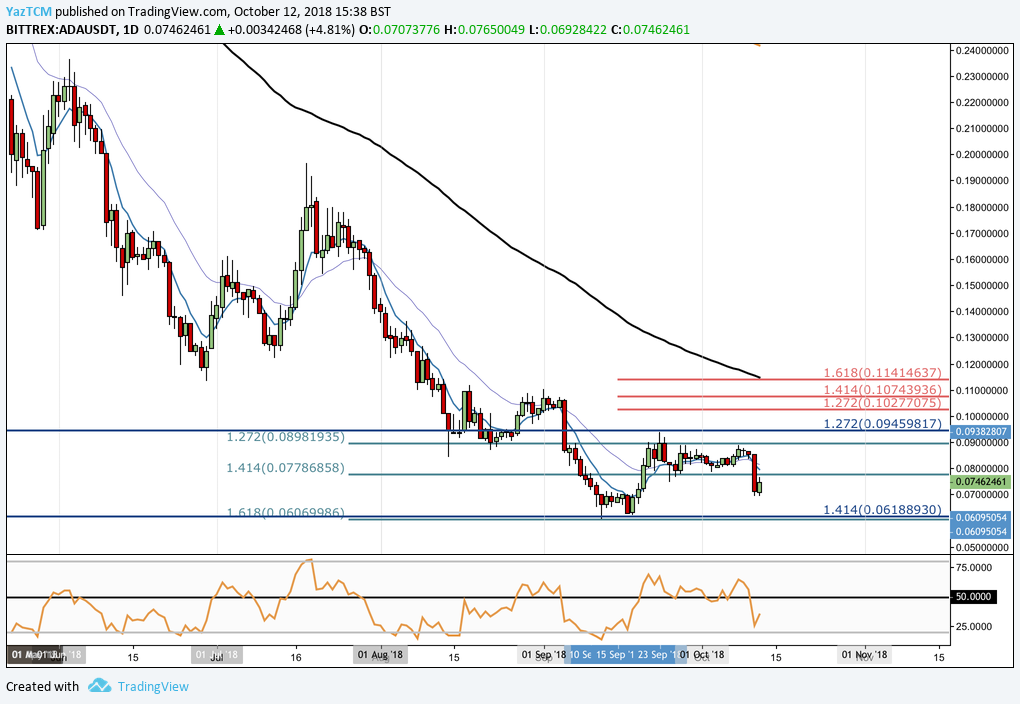
Analysing price action from the benefit of a shorter termed perspective, we can see that the support at the long term downside 1.414 Fibonacci Extension level was significantly boosted by a shorter termed downside 1.618 Fibonacci Extension level priced in the same area.
We can see that after rebounding from the area of highlighted support, price action went on to rally until meeting resistance toward the upside at the short term 1.272 Fibonacci Extension level priced at $0.08981.
We can also see that the market has now been trading within a trading range for the past 6 weeks or so, bound between $0.06 as the lower boundary and $0.08981 as the upper boundary of the trading range.
Moving forward, if the bears continue to pressure price action lower, we can expect immediate support below to be located at the psychological round number handle of $0.07 followed by the significantly combined support level at the lower boundary of the trading range priced at $0.06.
Alternatively, if the bulls can regather momentum and push price action higher, we can expect immediate resistance higher to be located at the short term 1.414 Fibonacci Extension level priced at $0.07786 followed by the upper boundary of the trading range priced at $0.08981.
If the bulls can continue to push price action further higher then we can expect further resistance above to be located at the longer termed downside 1.272 Fibonacci Extension level priced at $0.0945. If they can continue even further higher then more significant resistance can be located at the short term upside 1.618 Fibonacci Extension level (drawn in red) priced at $0.1141. This area of resistance is significantly bolstered by the 100 day moving average which is also currently hovering within the same price area.


