Summary
A Bull Run is looking likely after a protracted bearish rally for the various cryptos. Over the last 24 hours, both Ethereum and Bitcoin lost negligibly with all indicators pointing towards better prices in the coming days. Today’s focus coins performed as follows:
- Bitcoin has been moving up despite an overall bearish outlook. It is down by 0.5% and is currently trading at $3862.
- Ethereum has been overcome by a downtrend and is down by 1% (0.96%) over the last 24 hours.
Bitcoin (BTC/USD)

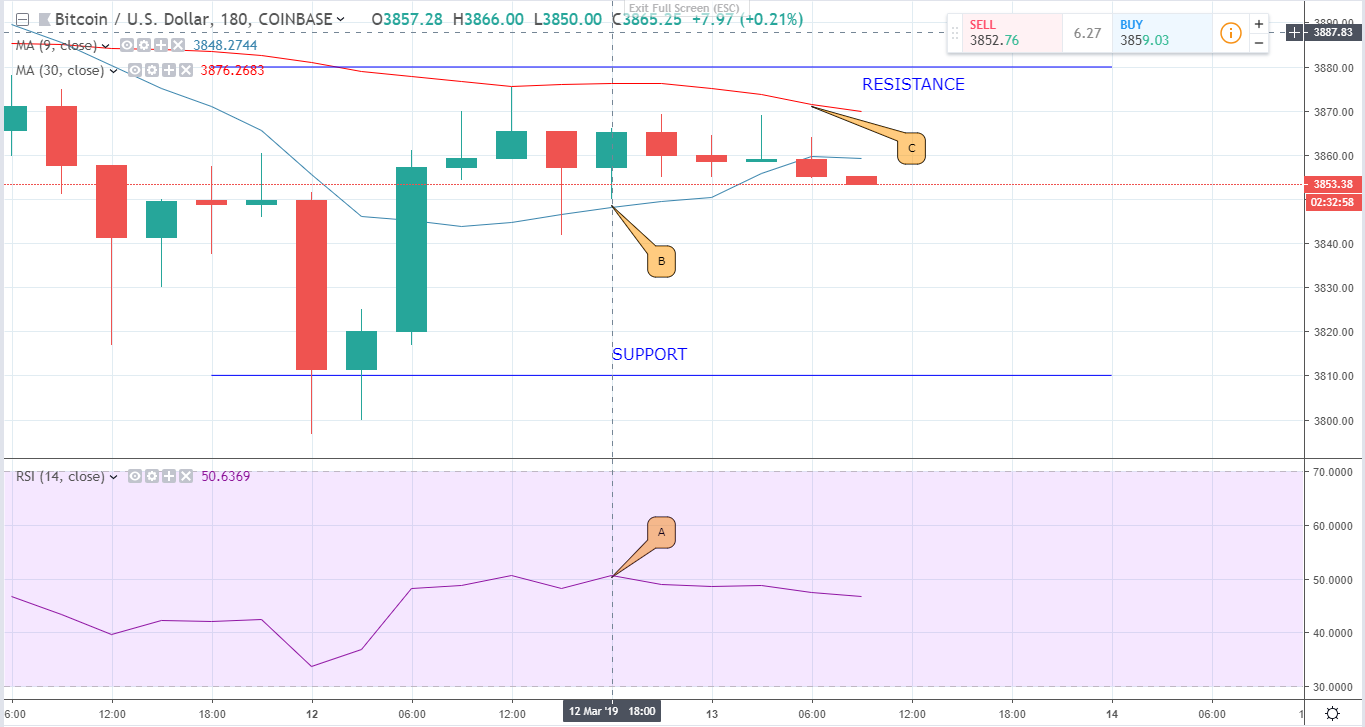
The most popular coin by market capitalization figures began the day trading at $3870 and is now at $3862. This translates to a 0.5% dip in its value. The bearish rally was also reflected in the market (A) as well as in both Moving Averages (B and C).
In the markets, investor sentiments rose slightly before embarking on a steady flow. This is perhaps owing to BTC’s inability to break past the $4000 mark. Resistance has strongly held at $3880 with very few attempts at breaching the said resistance zone.
On the other hand, support has been bettered. It moved up from $3809 to $3839 which shows a strong price consolidation at around the $3800 mark.
Among investors, sentiments are high with most of them looking to buy the dip in anticipation for better prices.
Forecast
At the moment, the long term moving average (C) – 30 day EMA is above the short term Moving Average (B) – 9 day EMA. Also, the 30 day EMA has dominantly been on top which signals a strong bearish outlook in the coming days.
However, if the Bulls can up their momentum, the bearish rally may be overcome seeing that the two EMAs are tending towards each other in a contracting triangular pattern which shows an impending Bull Run.
Ethereum (ETH/USD)

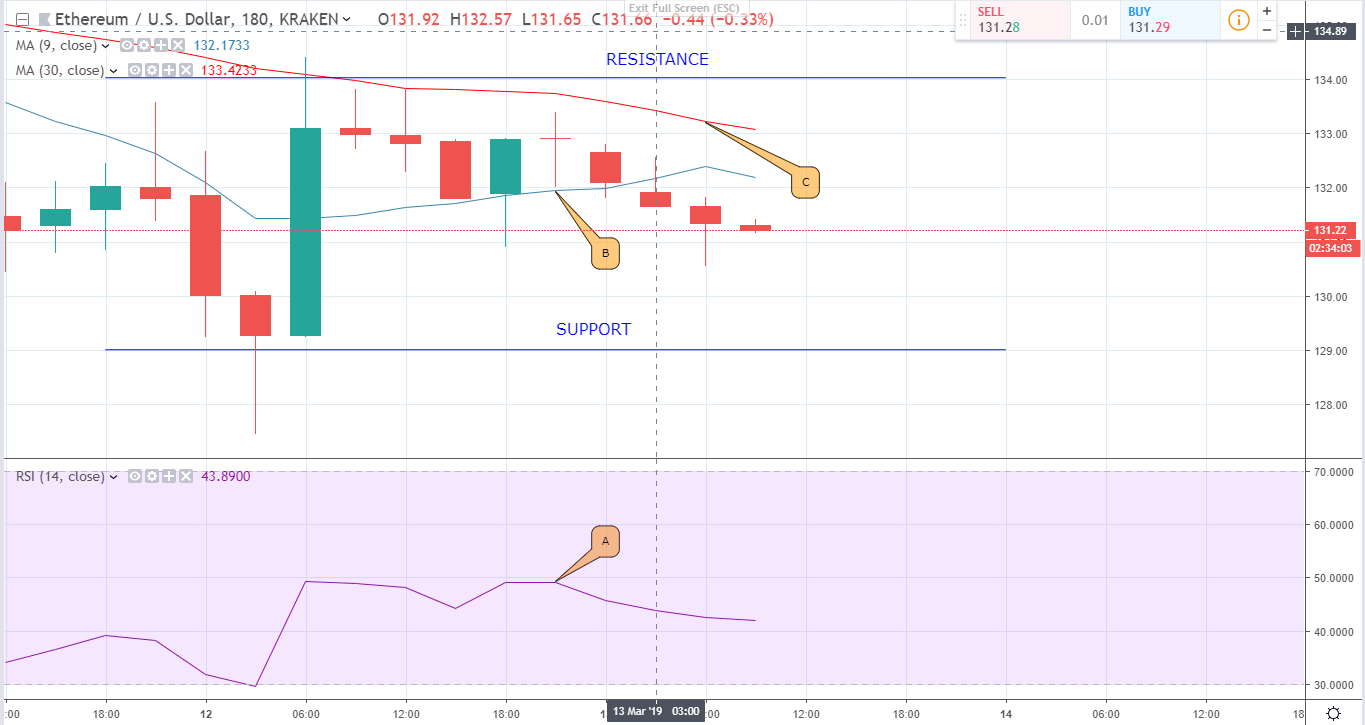
Over the last 24 hours, the ETH/USD pair is down by 0.85%, having started off selling at $131.01 against the current $130.27. The effect of this drop has been a dip in investor sentiments as seen in the RSI (A). It is near the ‘oversold’ area (70) more than the ‘undersold’ area (30). This means investors are increasingly preferring to sell off their holdings as opposed to HODLing them for better prices.
Forecast
The 9 day EMA (C) is upward facing while the 30 day EMA (B) is headed down. The two form a contracting triangular pattern between them which indicates a Bull Run in the coming days.


